Surging Nvidia Stock Keeps Drawing In More Believers
The chip company that is cashing in on the market’s artificial-intelligence obsession seems to many investors like an unstoppable force

 5 min
5 min
Nvidia ’s historic run is minting profits for investors big and small . Many are betting the boom is just beginning.
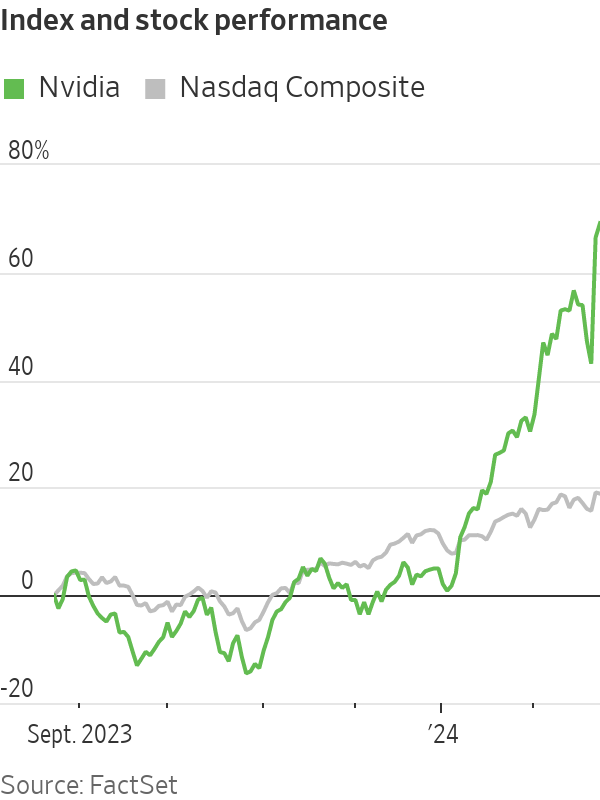
They are piling into trades that the chipmaker’s shares, which have more than tripled over the past year , are headed still higher. Some have turned to the options market to look for ways to turbocharge their bets on artificial intelligence after a blockbuster earnings report sent the stock up 17% over the past two days.
The exuberance reflects hope that the company is the vanguard of wide adoption of artificial intelligence—and an intense fear of missing out among investors who have sat on the sidelines while the company’s valuation has eclipsed $2 trillion .
With the help of Nvidia, stocks have stormed into 2024 . The S&P 500, which has chalked up fresh records in recent weeks, is up 6.7%. That is the index’s second-best performance for this time period over the past 10 years. The gains were only surpassed by an 11% increase in 2019.
Nvidia has contributed to about a quarter of those gains, according to S&P Dow Jones Indices.
The Nasdaq, too, is up 6.6% this year and neared a record Friday. The tech-heavy index has been boosted by Nvidia, which this week tacked on $277 billion in additional market value, along with six other tech titans collectively known as the Magnificent Seven.
The Dow Jones Industrial Average is up 3.8% this year and has hit repeated records in recent weeks.
“You look at these numbers and what this company’s done—it’s almost without precedent,” said Mike Ogborne, founder of San Francisco-based hedge fund Ogborne Capital Management, who counts Nvidia among his top five biggest holdings . “It is nothing short of amazing.”
Ogborne compared AI with the launch of the internet more than two decades ago, which kick-started a technology craze that lasted years.
“It’s exciting,” Ogborne said. “It’s great for America.”
Unfazed by questions about AI
Tamar June in Reno, Nev., is one investor along for Nvidia’s furious stock-market ascent. Since the 1990s, the 61-year-old software-company chief executive has been buying shares of tech firms, including Apple , Microsoft , Cisco, Intel and Oracle . June had been familiar with Nvidia for some time but in recent years kept reading about the chip company in the news. She liked that it was profitable and growing.
June decided to purchase some shares in 2022 at about $260, then watched the stock erase more than half of its value later that year. She held on, knowing that Nvidia’s graphics processing units were in high demand for cloud computing. Then, an AI frenzy hit the stock market in 2023, sending Nvidia’s stock soaring.
Now, Nvidia shares are closing in on $800, and June is looking for opportunities to buy more. She isn’t fazed by worries that the AI boom is bound to come crashing down. June experienced the bursting of the dot-com bubble and the 2008 financial crisis—and watched stocks bounce back to new highs.
“I think it’s still in the beginning stages,” June said of AI developments. “There’s still a lot of headroom for technology because our whole future depends on it.”
$20 billion in options
A herd of investors chased Nvidia while it raced toward its $2 trillion valuation.
At Robinhood Markets , Nvidia was the most purchased stock by customers on a net basis and received the heaviest notional trading volumes over the past month, according to Stephanie Guild, head of investment strategy at the digital brokerage.
The rise drove many traders to pile into the company’s options, a risky corner of the market notorious for boom-and-bust trades.
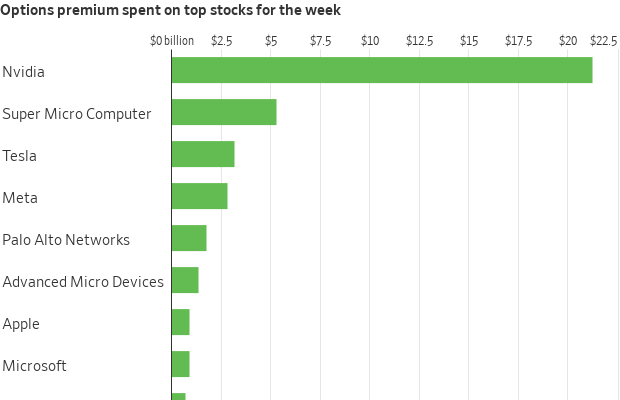
Nvidia has also morphed into one of the most popular trades in this market, with traders placing more than $20 billion in stock-options bets tied to the company over the past week, according to Cboe Global Markets data. That was more than what they spent on Tesla , Meta Platforms , Microsoft, Apple, Amazon and Alphabet combined.
Call options, contracts that confer the right to buy shares at a specific price, were particularly popular. And many of the trades appeared to suggest that investors were fearful of missing out on bigger gains to come. Some of the most active trades Friday were calls pegged to the shares jumping to $800 or $850, up from their closing price of $788.17. Betting against the shares has been a losing game , leading many investors to throw in the towel on bearish wagers.
The values of many of these options bets exploded while Nvidia soared, rewarding those who piled in. The big gains also enticed others to join in the trades while the stock’s rally continued.
“There’s a snowball effect,” said Henry Schwartz, a vice president at exchange-operator Cboe Global Markets, of the options activity surrounding Nvidia.
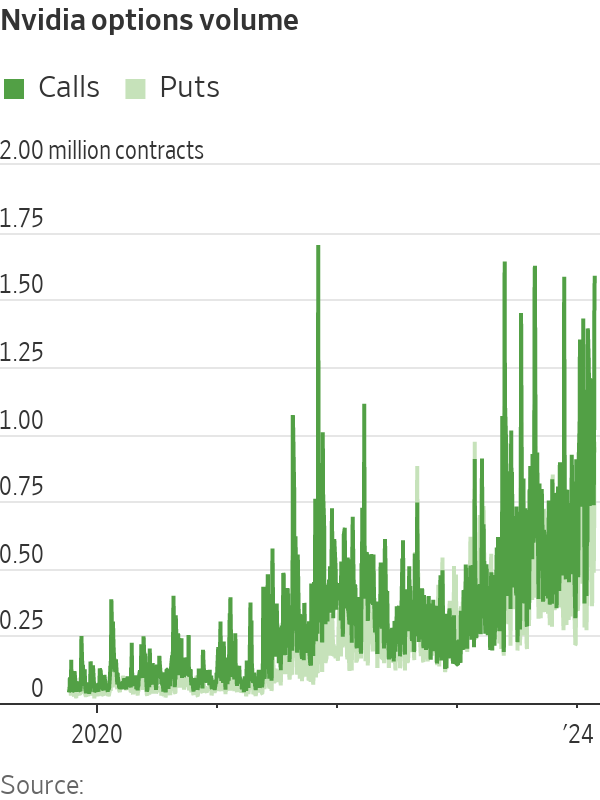
Ahead of the tech behemoth’s earnings report Wednesday, options pegged to the shares jumping to $1,300 —around double where they were trading at the time—were some of the most popular trades.
And for some investors, the 16% one-day jump in Nvidia’s share price Thursday wasn’t enough. They sought even bigger returns and piled into several niche exchange-traded funds that offer magnified exposure to Nvidia stock.
The GraniteShares 2x Long NVDA Daily ETF has taken in almost half a billion dollars from investors on a net basis since launching late in 2022. The fund’s shares have more than doubled in 2024 and have surged nearly 650% since inception.
There have been few signs of profit-taking so far. Investors added a net $263 million to the fund in the past month. The fund’s cousin, which turbocharges bearish bets against Nvidia, has been much less popular.
The euphoria surrounding Nvidia has spread to other stocks, too. Shares of Super Micro Computer , a much smaller company worth less than $50 billion, popped more than 30% Thursday after Nvidia’s earnings report. Traders spent more than $5 billion on options tied to the company, more than what they spent on Tesla this week. Tesla is worth about 13 times as much as the company.
Software that is eating the world
Nvidia’s continued, rapid ascent has stunned even early bulls on semiconductors and generative AI.
Atreides Management founder Gavin Baker, who started covering Nvidia as an analyst at Fidelity in 2000, reminded investors in his Boston hedge fund in an early 2021 letter of Marc Andreessen ’s adage that software was eating the world. “Today, AI is replacing software,” he wrote.
Atreides started buying Nvidia shares in the fourth quarter of 2022, according to regulatory filings.
The wager proved profitable. But as Nvidia shares kept soaring, Baker started selling. Atreides was out of Nvidia by the end of the second quarter of 2023. “This has been a painful mistake,” Baker wrote in a June 2023 letter to his clients, when Nvidia was trading north of $420 a share.
Atreides’s stake in competitor Advanced Micro Devices has helped alleviate the pain from missing out on larger gains. The firm made nearly a quarter billion last year alone on AMD, which it continues to hold along with several other related bets.
Michael Hannosh, a 20-year-old college student in Chicago, said he first purchased shares of Nvidia in August 2022, when the stock traded below $180. Nvidia was one of his first-ever stock purchases. He had built a custom computer for videogaming and used a lot of Nvidia parts.
Hannosh said he kept the shares until last March, then sold them for a roughly 30% profit. He later bought a few more shares at about $230 and sold them over the course of the next several days at a profit.
The shares have tripled since.
“It’s blown my f—ing mind to bits. It’s insane,” said Hannosh. “I really wish I held it, obviously.”
 Copyright 2020, Dow Jones & Company, Inc. All Rights Reserved Worldwide. LEARN MORE





A record-breaking $11 million sale at The Centennial Collection has set a new benchmark for luxury apartment living in Bondi Junction.

As interest rates, inflation and market sentiment fluctuate, investors are being urged to focus on data, not panic.


The Federal Budget may have softened some of its proposed tax reforms, but it has exposed a bigger issue: too many families are relying on wealth structures that no longer reflect the realities of modern life.
3 min
For many Australians, the 2026 Federal Budget initially felt like a direct challenge to the way wealth is created, held and transferred between generations.
The headlines were immediate: changes to capital gains tax, reforms to discretionary trusts, restrictions on negative gearing and increased scrutiny of investment structures. Unsurprisingly, affluent families, business owners and investors began asking the same question:
Is the way we hold our wealth still fit for purpose?
In recent days, the government has announced several significant amendments following industry consultation and public feedback, including exempting testamentary trusts from the proposed 30 per cent minimum tax and expanding capital gains tax concessions for small businesses.
The backdown is welcome. But it also highlights something much bigger.
This Budget has accelerated a conversation that many Australian families have been postponing for years.
The conversation is not really about tax. It is about wealth stewardship.
For decades, Australians have built wealth through businesses, property, investments and careful long-term planning. Yet many families have not revisited the legal structures surrounding those assets in years, sometimes decades.
We often see clients who have spent years building significant wealth, only to discover their legal arrangements no longer reflect their current circumstances.
Their children are now adults. They may own multiple properties.
They may have sold a business, entered a second marriage, become grandparents or accumulated digital assets that did not exist when their original estate plans were prepared.
The trust that distributes income may need to be reconsidered. The bucket company may no longer be so attractive.
The Budget has simply exposed a reality that already existed: wealth structures cannot remain static while life continues to evolve.
Importantly, trusts themselves are not the issue.
Trusts are legitimate planning tools that provide flexibility, protection and continuity. When used appropriately, they allow families to adapt to changing circumstances over time.
And neither is tax the issue, really. Getting the fundamentals right is more important for long-term, sustainable wealth than a few favourable tax treatments around the edges.

The real issue is complacency.
Too often, families create structures and assume the job is done. It isn’t.
Estate planning is no longer a document you sign once and file away in a drawer. It is an ongoing process that should evolve alongside your life.
We are also seeing a broader shift in how Australians define wealth itself. It is no longer just the family home and an investment portfolio.
Modern wealth includes businesses, digital assets, cryptocurrency, intellectual property, frequent flyer points and increasingly complex family arrangements.
At the same time, Australians are living longer than ever before, meaning wealth may need to support multiple generations simultaneously. This creates new responsibilities and new risks.
How do you help your children enter the property market without exposing family wealth to relationship breakdowns?
How do you structure wealth so that it remains a source of opportunity rather than future conflict?
These are the questions families should be asking now.
The recent debate surrounding testamentary trusts also serves as an important reminder that policy decisions can have unintended consequences for vulnerable Australians. It is encouraging that the government has listened to feedback and clarified its position.
But the lesson remains: the wealth landscape is changing.
Increasingly, governments, regulators and tax authorities are paying closer attention to how wealth is held and transferred. That means families cannot afford to adopt a “set-and-forget” approach to their structures.
The families who will be best placed for the future are not necessarily those with the greatest wealth.
They are the families with the greatest clarity. Clarity around ownership, succession and governance. And clarity around how wealth will transition from one generation to the next.
Ultimately, preserving wealth is not about avoiding change.
It is about preparing for it.
Because the greatest risk is not change itself.
It is losing the ability to respond to it.
Anthony Hunt is Co-Founder of Wealth Lawyers and former COO of Westpac Private Bank. He advises business owners, investors and affluent Australian families on wealth protection, succession planning and intergenerational wealth transfer
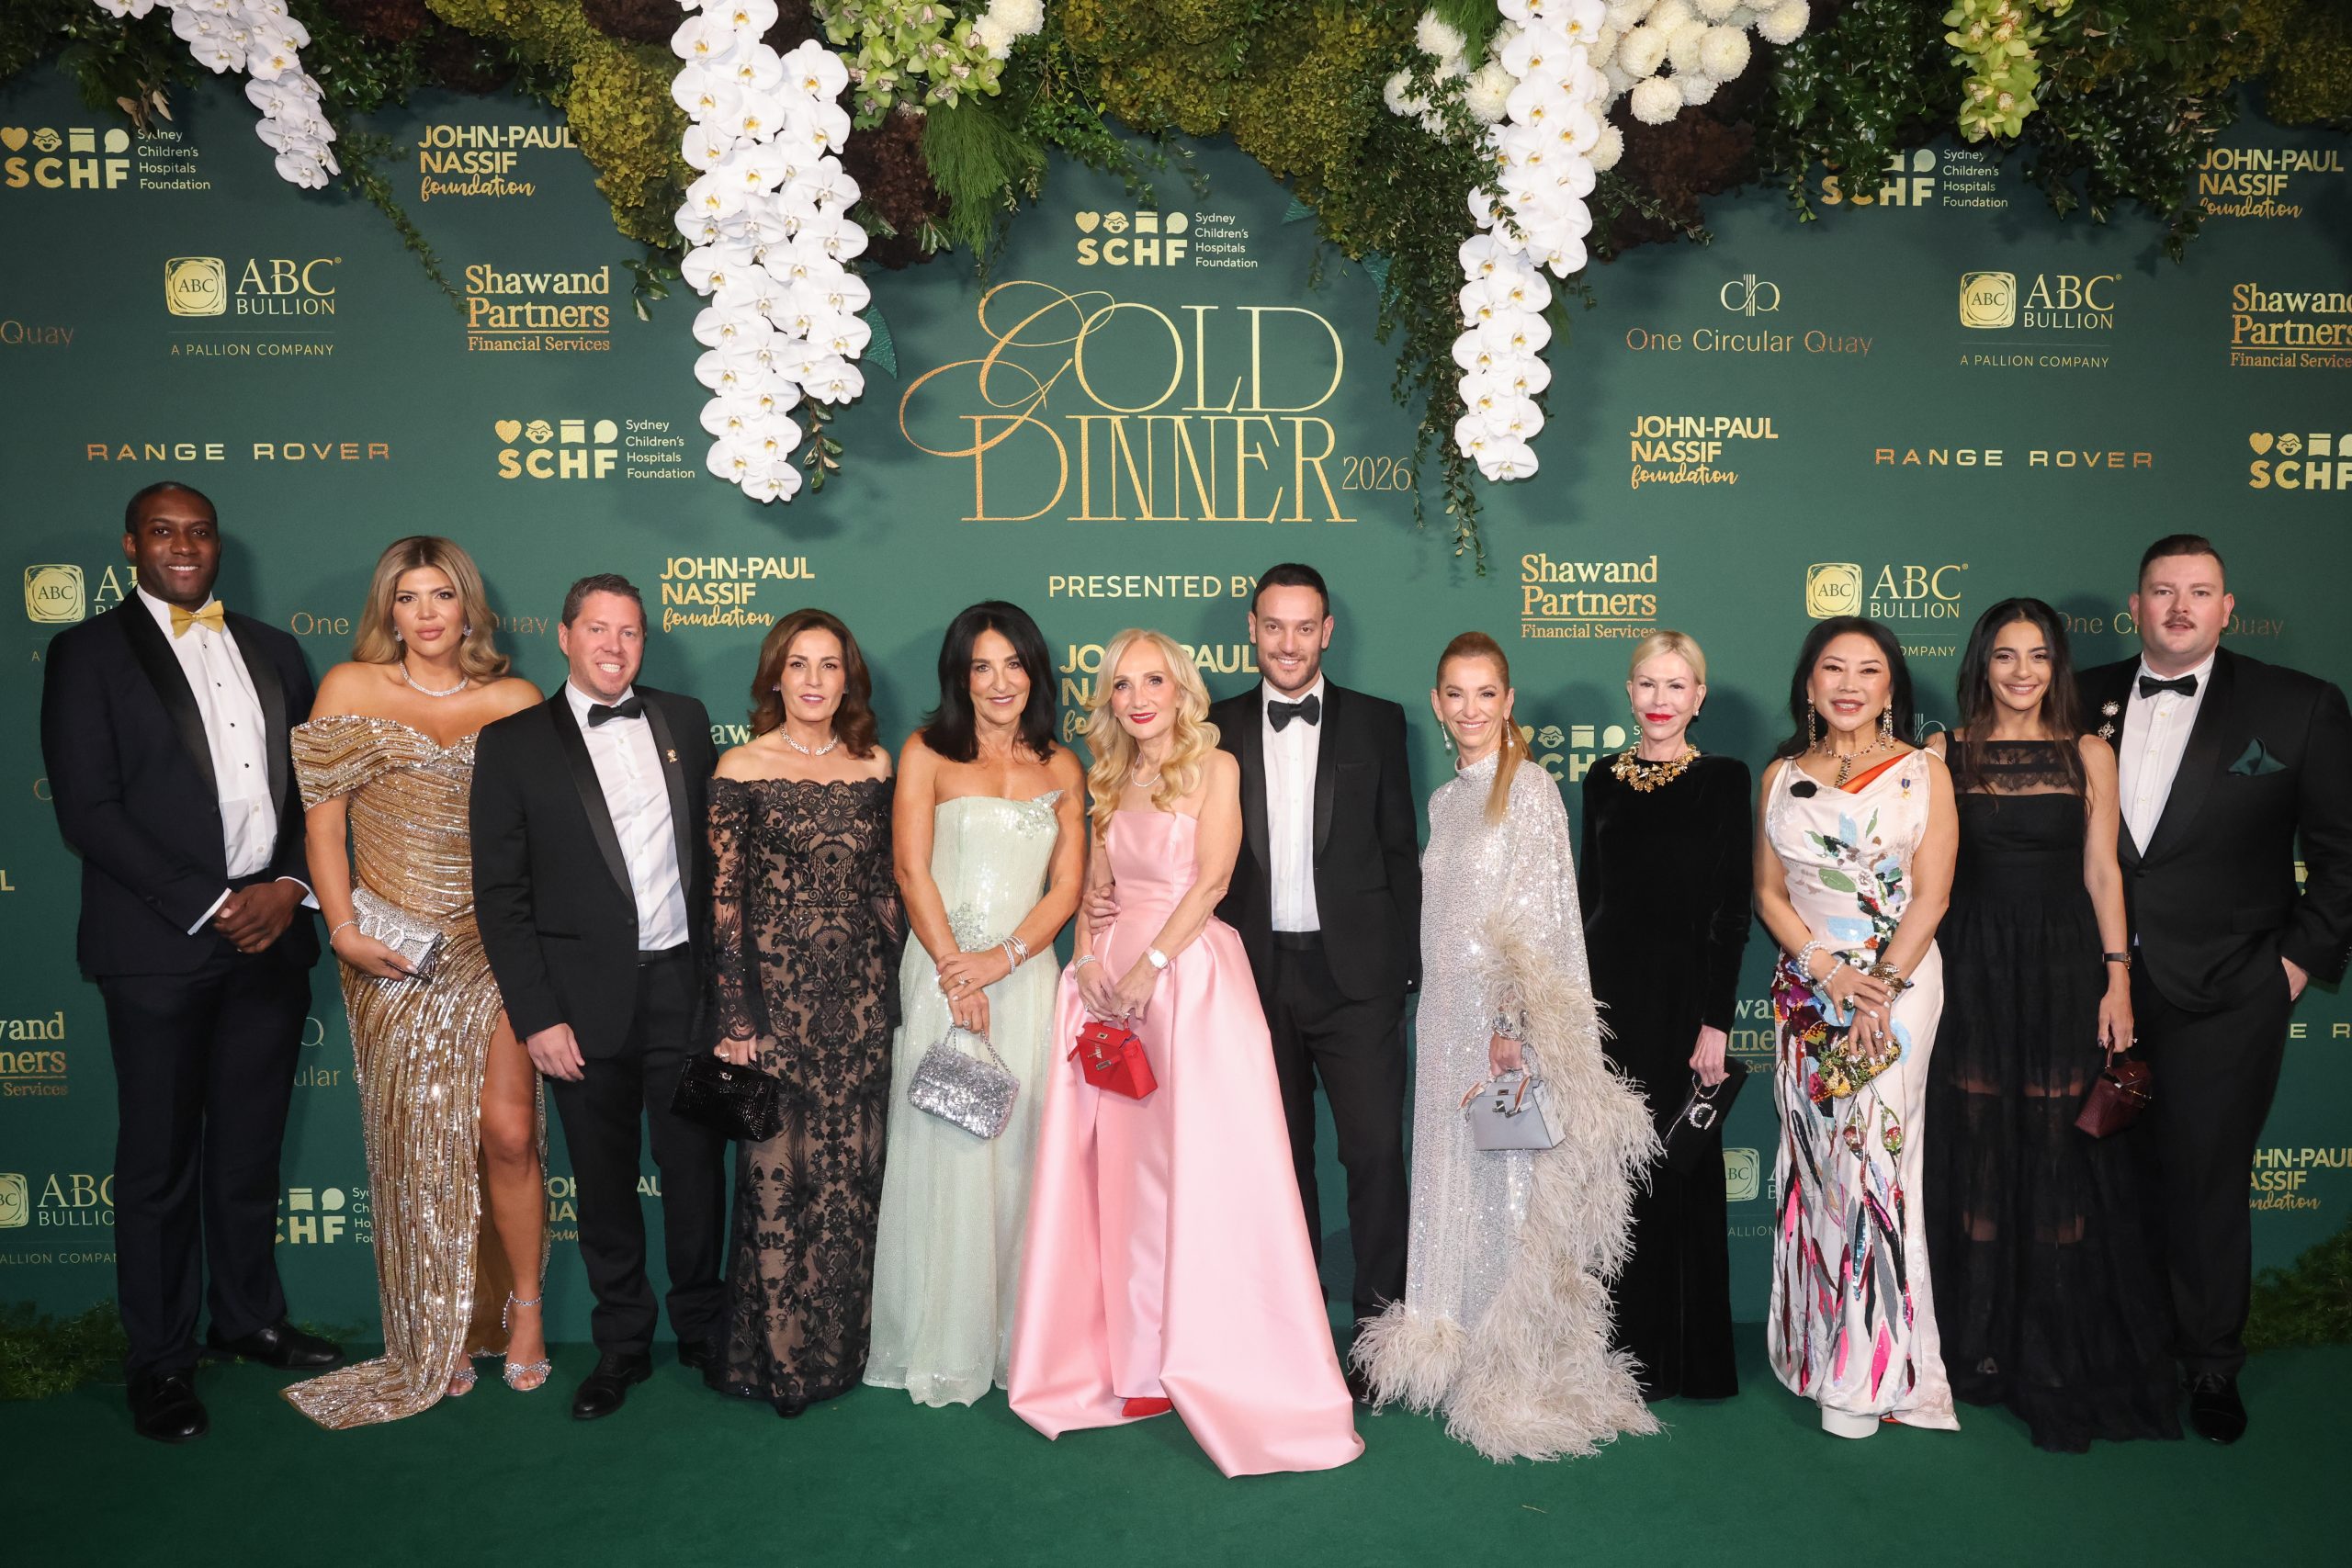
Sydney Children’s Hospitals Foundation CEO Kristina Keneally says Australia’s culture of large-scale philanthropy is becoming more sophisticated as Gold Dinner raises $75.5 million for children’s health, research and innovation.

Three completed developments bring a quieter, more thoughtful style of luxury living to Mosman, Neutral Bay and Crows Nest.