Why ESG Investing Might Never Recover
The appeal of the moniker is waning, probably because it is trying to serve too many interests at once

 4 min
4 min
The ESG brand probably has its best days behind it.
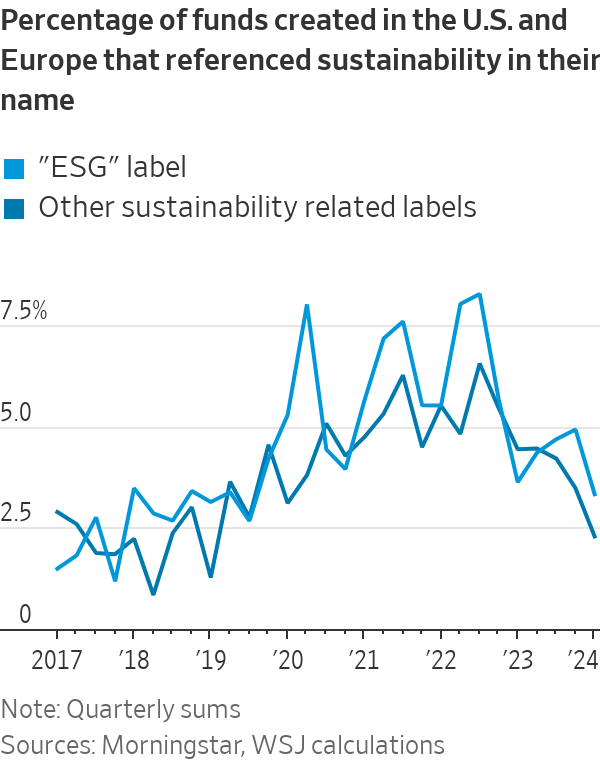
Following a three-year craze for investment products focused on environmental, social and corporate-governance concerns, the percentage of newly created funds in the U.S. and Europe with ESG in their name has fallen from a peak of 8.3% to just 3.3%, according to an analysis of quarterly data by Morningstar Direct.
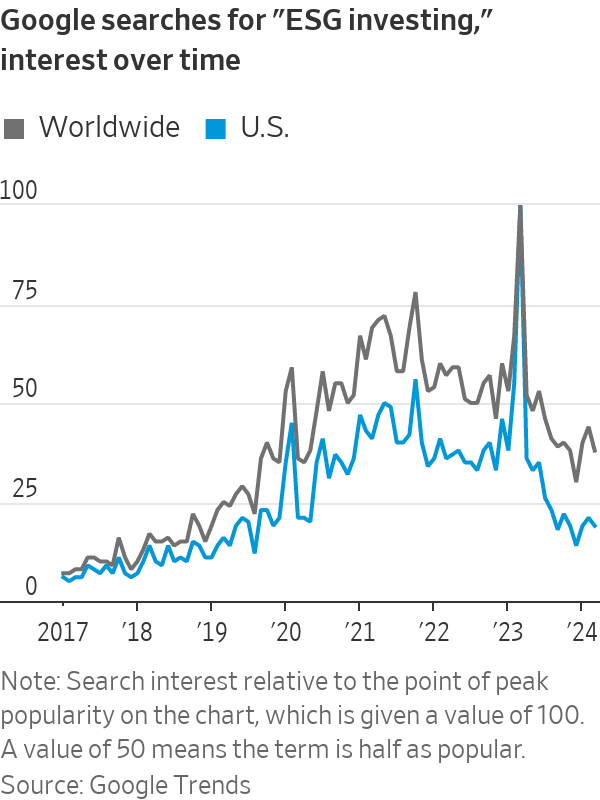
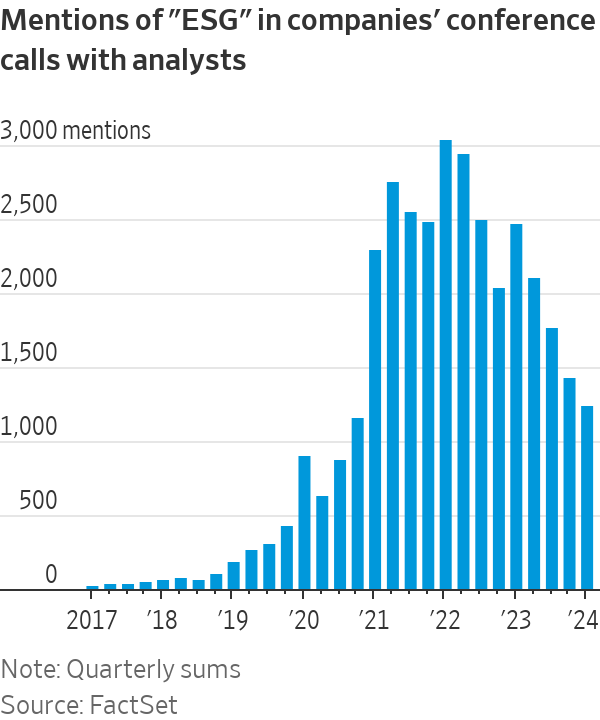
Likewise, online searches for “ESG investing” have plummeted back to mid-2019 levels, according to Google Trends. Mentions of the term in company analyst calls have dropped 59% from their quarterly peak in 2022, FactSet data suggest.
One explanation is the collapse of the clean-energy stocks most readily associated with the ESG movement. Flagging growth in electric-vehicle sales has hit sector behemoth Tesla . The S&P Global Clean Energy index, which lists solar-panel maker First Solar and Danish wind-turbine giant Vestas among its top constituents, has lost 31% since the start of 2023 as renewable-energy projects have been shelved. That compares with returns of 27% for global stocks.
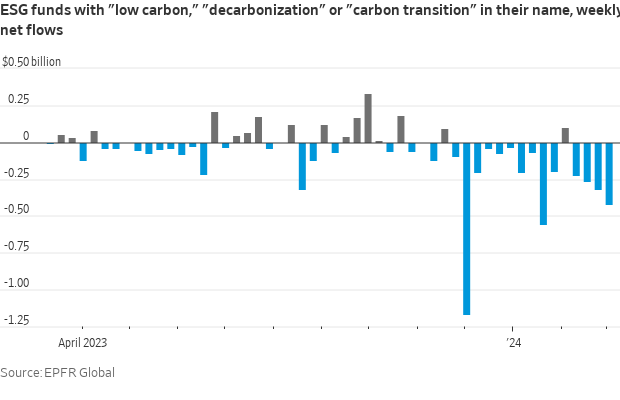
The rise of ESG investing between 2019 and 2022 coincided with a surge in clean-tech valuations, and now the reverse is happening. Investors have pulled $2.2 billion from funds dedicated to decarbonisation since the start of the year, according to EPFR, and the outflows are getting larger every week.
There is a risk that ESG was an investment fad rather than a financial revolution extending across all industries.
The term was the product of an uneasy three-way alliance. On one side were ethically driven investors, who are particularly widespread in Scandinavia and include pension funds, universities and religious organisations united in wanting to shun contentious firms. On another were institutions such as the United Nations that aimed to channel money to industries that benefit society. Finally, there were investors who wanted to profit from the green revolution.
Asset managers jumped at the chance to cater to all three simultaneously. ESG allowed them to differentiate their products, revitalise the case for active management and, at a time of declining fees, charge more for stock screens that often lead to only small changes in allocations . Among U.S. equity funds, ESG strategies have an asset-weighted average fee of 0.52%, compared with 0.33% overall, Morningstar Direct data shows.
But the confusion of motivations made for contradictions and a lot of doublespeak. Neither ethical objectives nor bets on decarbonisation square logically with fund managers’ claims that ESG is a broad path to higher, safer returns.
Yes, an ESG focus can help active managers account for risks such as a regulatory backlash or governance blow up, which in some cases might be highlighted by new company disclosures. This month the European Union cleared the way toward requiring firms to better report and address sustainability impacts.
However, the assumption that integrating ESG criteria into their screening will lead to better stock picking seems flawed . The very popularity of ESG makes it unlikely that the market is under appreciating the risks. The rush of money into firms like Vestas, whose stock hit a price-to-earnings ratio of 534 in 2022, illustrates the risk that shares with high sustainability scores can get too expensive, leading to lower returns.
Ethical investors might be fine with this, but that just shifts the focus to what counts as ethical. Tellingly, interest in ESG has dropped more in the U.S., where the politicisation of EVs and culture wars surrounding Bud Light beer show how easily corporations can become ideological battlegrounds.
ESG ratings aren’t much help in navigating these issues. Different providers give wildly different scores to the same companies, even within the specific “E,” “S” and “G” factors, according to a February paper by the Leibniz Institute SAFE. Researchers also found that environmental concerns tend to explain most of the overall score.
This is another hint that the ultimate driver of the pandemic-era ESG craze might have been a hunger for thematic investment. It has since found better sources of sustenance, as demonstrated by the breakneck growth of firms such as Global X, which is delivering increasingly granular offerings such as tracker funds for electric batteries, cloud computing and ageing populations.
Buyers of these products can be fickle and jump to the next theme—often too quickly for their own good, a Morningstar analysis showed last November. It is possible that the overly generic ESG brand will never recover its appeal, with the different parts of it eventually rebranded to suit their specific client bases. BlackRock , the world’s largest asset manager, has already dropped it and is now emphasising transition themes over ethical stewardship of companies.
Sustainable investing isn’t going anywhere. But a broad tent covering too many interests serves none of them well.
 Copyright 2020, Dow Jones & Company, Inc. All Rights Reserved Worldwide. LEARN MORE





BNW Developments has established a Sydney presence, joining Arada and Sobha Realty among the growing number of UAE developers pursuing Australian buyers and development opportunities.

Australian shares fell on Thursday as Wall Street weakness, rising oil and persistent rate concerns weighed on most of the market. The S&P/ASX 200 declined 0.72 per cent to 8,702. The All Ordinaries lost 0.66 per cent to finish at 8,897. Mining stocks were hit particularly hard, while real estate also dragged on the index. …
Continue reading “ASX falls 0.7 per cent as miners and property stocks retreat”

 2 min
2 minAustralian shares fell on Thursday as Wall Street weakness, rising oil and persistent rate concerns weighed on most of the market.
The S&P/ASX 200 declined 0.72 per cent to 8,702. The All Ordinaries lost 0.66 per cent to finish at 8,897. Mining stocks were hit particularly hard, while real estate also dragged on the index.
Energy was the notable exception, gaining more than one per cent as Brent crude traded above US$103 a barrel. Oil had moved higher amid uncertainty surrounding potential US diesel-export restrictions and broader geopolitical supply risks. The move supported energy producers but renewed concern about inflation inputs across transport and the wider economy.
Gold shares were weak even as spot bullion remained historically elevated. The All Ordinaries Gold index fell about 2.25 per cent, showing that equity performance can diverge from the commodity because of valuation, currency, operating and company-specific factors.
Zip was a prominent loser, falling 11.38 per cent after the company reported short sales after the previous close. Nine Entertainment also weakened after UBS analysts warned of near-term revenue challenges associated with its advertising-supported subscription tier.
Premier Investments led larger winners despite caution about the retail environment. Breville, in which Premier owns a significant stake, also appeared among leading movers. In the broader ASX 300 screen, Myer gained 11.43 per cent and MAAS Group rose 7.93 per cent, while Lotus Resources fell 10.53 per cent. These percentage moves should be checked against company announcements and trading liquidity before attributing causes.
The Australian dollar was broadly flat at US70.38 cents. Spot gold was around US$4,280 an ounce, Brent crude approximately US$103.08 a barrel and iron ore near US$96.90 a tonne late in the session.
The rate outlook remains the central domestic catalyst. Labour-market weakness has not eliminated the possibility of an RBA increase next week, leaving banks, listed property and other rate-sensitive sectors exposed to changing expectations.
Market dashboard
S&P/ASX 200: 8,702, down 0.72 per cent.
All Ordinaries: 8,897, down 0.66 per cent.
Best sector: Energy, up more than one per cent.
Weakest areas: Real estate and materials were the major drags; confirm final sector percentages before publication.
Material winner: Premier Investments led the large-company gainers. Confirm its final closing move from the ASX before publication.
Material loser: Zip, down 11.38 per cent.
ASX 300 percentage leader: Myer, up 11.43 per cent.
ASX 300 percentage laggard: Zip, down 11.38 per cent.
AUD/USD: Approximately US$0.7038, broadly flat.

From snow-dusted valleys to festival-filled autumns, Bhutan reveals itself as a rare destination where culture, nature and spirituality unfold year-round.

The pandemic-fuelled love affair with casual footwear is fading, with Bank of America warning the downturn shows no sign of easing.