Taylor Swift Joins Elon Musk on Global Billionaire Rankings

 3 min
3 min
Elon Musk has some new company on the list of the world’s richest people: Taylor Swift, who’s now reached her billionaire “era.”
Buoyed by the rise in Tesla stock and the surge in SpaceX’s valuation, Musk has reclaimed the title of the world’s richest person in an annual ranking of billionaires.
Musk’s US$231 billion fortune catapulted him above Amazon executive chairman Jeff Bezos (US$185 billion) and LVMH CEO Bernard Arnault (US$175 billion), who ranked second and third, respectively, on the 13th Hurun Global Rich Report, an annual survey from China-based media and research firm Hurun. This year marked Musk’s third time in four years at the top of the roster.
Swift made her debut on the list, her wealth, estimated at US$1.2 million, propelled by her Eras Tour and royalties from re-recording her albums.
Mark Zuckerberg (US$158 billion), CEO of Meta Platforms Inc., trailed at No. 4, but added more wealth than anyone on the list, as Meta shares more than doubled, the report said.
Miami-based entrepreneur Ryan Breslow (US$1.3 billion), the 30-year-old chairman of fintech platform Bolt, entered the list this year as its youngest self-made billionaire. While 66 is the average age of billionaires on the list, 93 billionaires ranked are 40 or younger.
The list ranked 3,279 billionaires, up from 3,112 the previous year. The number of billionaires increased by 5% and their total wealth was up 9%, Hurun said in a news release. The wealthiest hail from 2,435 companies and 73 countries.
The wealth calculations are through Jan. 15 of this year.
For the first time, more than half the new wealth on the list was generated by the boom in AI, the report said.
“AI has been the major driver for wealth growth,” Rupert Hoogewerf , Hurun’s chairman and chief researcher, said in a statement. “Whilst [Nvidia president] Jensen Huang has grabbed many of the headlines as Nvidia broke through the US$2 trillion mark and catapulting him into the Hurun Top 30 as a result, the billionaires behind Microsoft, Google, Amazon, Oracle and Meta have seen significant surges in their wealth as investors bet on the value generated by AI.”
Despite losing 155 billionaires, China still claims the most, with 814, the report said. The U.S. added 109 billionaires, for a total of 800. India added 84, and now has almost double the number of billionaires as the U.K., the report said.
If there’s a billionaire capital, it’s New York, where more reside than any other city; London ranked second, and Mumbai third, edging out other locales to become Asia’s hub for billionaires.
Overall, the world’s wealthiest made their money in financial services (10%), followed by consumer goods (8%), and food & beverages (7%) and real estate (7%), Hurun said. By sector, it was a “good year” for media and entertainment, which added US$226 billion, outpacing software and services at US$149 billion, financial services at US$118 billion, and retail, at US$104 billion.
Not everyone was a winner. The report said 1,346 billionaires saw their wealth decrease; 278 of them dropped off the list, with 208 of those hailing from China.
“Wealth creation in China has gone through deep changes these last few years, with the wealth of billionaires from real estate and renewables down,” Hoogewerf said in a statement. “Whilst as many as 40% of the Hurun Global Rich List from the high water mark two years ago have lost their billionaire status, China has added 120 new faces to the list.
The report called the latest rankings a “bad year” for healthcare, where billionaires in the field shed US$75 billion; followed by industrial products, declining US$46 billion; food & beverages, losing US$40 billion; and real estate, dropping by US$32 billion.
 Copyright 2020, Dow Jones & Company, Inc. All Rights Reserved Worldwide. LEARN MORE


From bushland greens to valley reds, the country’s most awarded designers are proving that the best colour palette was never on a swatch card; it was outside the window all along.

The Australian leather house has opened an immersive four-day pop-up in Manhattan, unveiling its Bloom Collection and redefining what a product launch can look like.


The federal budget has rattled property investors. But the biggest mistake isn’t the tax changes, it’s the conclusion many are drawing from them.
2 min
The recent budget has forced a reckoning for property investors.
Negative gearing now restricted to new residential builds, the CGT discount gone and on paper, the numbers look different.
And many investors are responding by pivoting toward yield, prioritising cash flow over capital growth in a way that property strategists say misses the point entirely.
“The debate has shifted to yield versus growth as if they are opposing forces,” says Abdullah Nouh, founder of Melbourne-based buyers’ agency Mecca Property Group. “But that framing is itself the mistake.”
Nouh, who works with high-net-worth families and investors on long-term acquisition strategy, argues that capital growth remains the primary driver of genuine wealth creation and that the post-budget environment has made quality assets more important, not less.
The numbers make his case plainly. An additional $500 per week in rental income is welcome. A prestige asset appreciating by $1 million over a market cycle is transformative.
These are not equivalent outcomes, and portfolios built around yield at the expense of location and land value tend to generate income while wealth stands largely still.
The more nuanced shift Nouh is seeing among sophisticated investors is a move toward assets where both outcomes can be engineered simultaneously – established homes on substantial land in quality locations, where the existing dwelling can be repositioned, rental returns improved, and the underlying land value compounds independent of what sits on it.
For investors with existing equity, commercial property is also entering the conversation in a more serious way.
Prestige industrial assets, medical centres and long-leased essential retail offer income profiles that residential property in most capital city markets cannot currently match: longer lease terms, tenants covering outgoings, and greater predictability than the residential tenancy cycle.
“The investors who build lasting wealth are rarely the ones who chased yield or growth exclusively,” says Nouh.
“They are the ones who built a strategy they could sustain – one that generated enough income to hold quality assets through multiple cycles while those assets compounded in value.”
The budget has changed the settings. It has not changed the fundamentals.
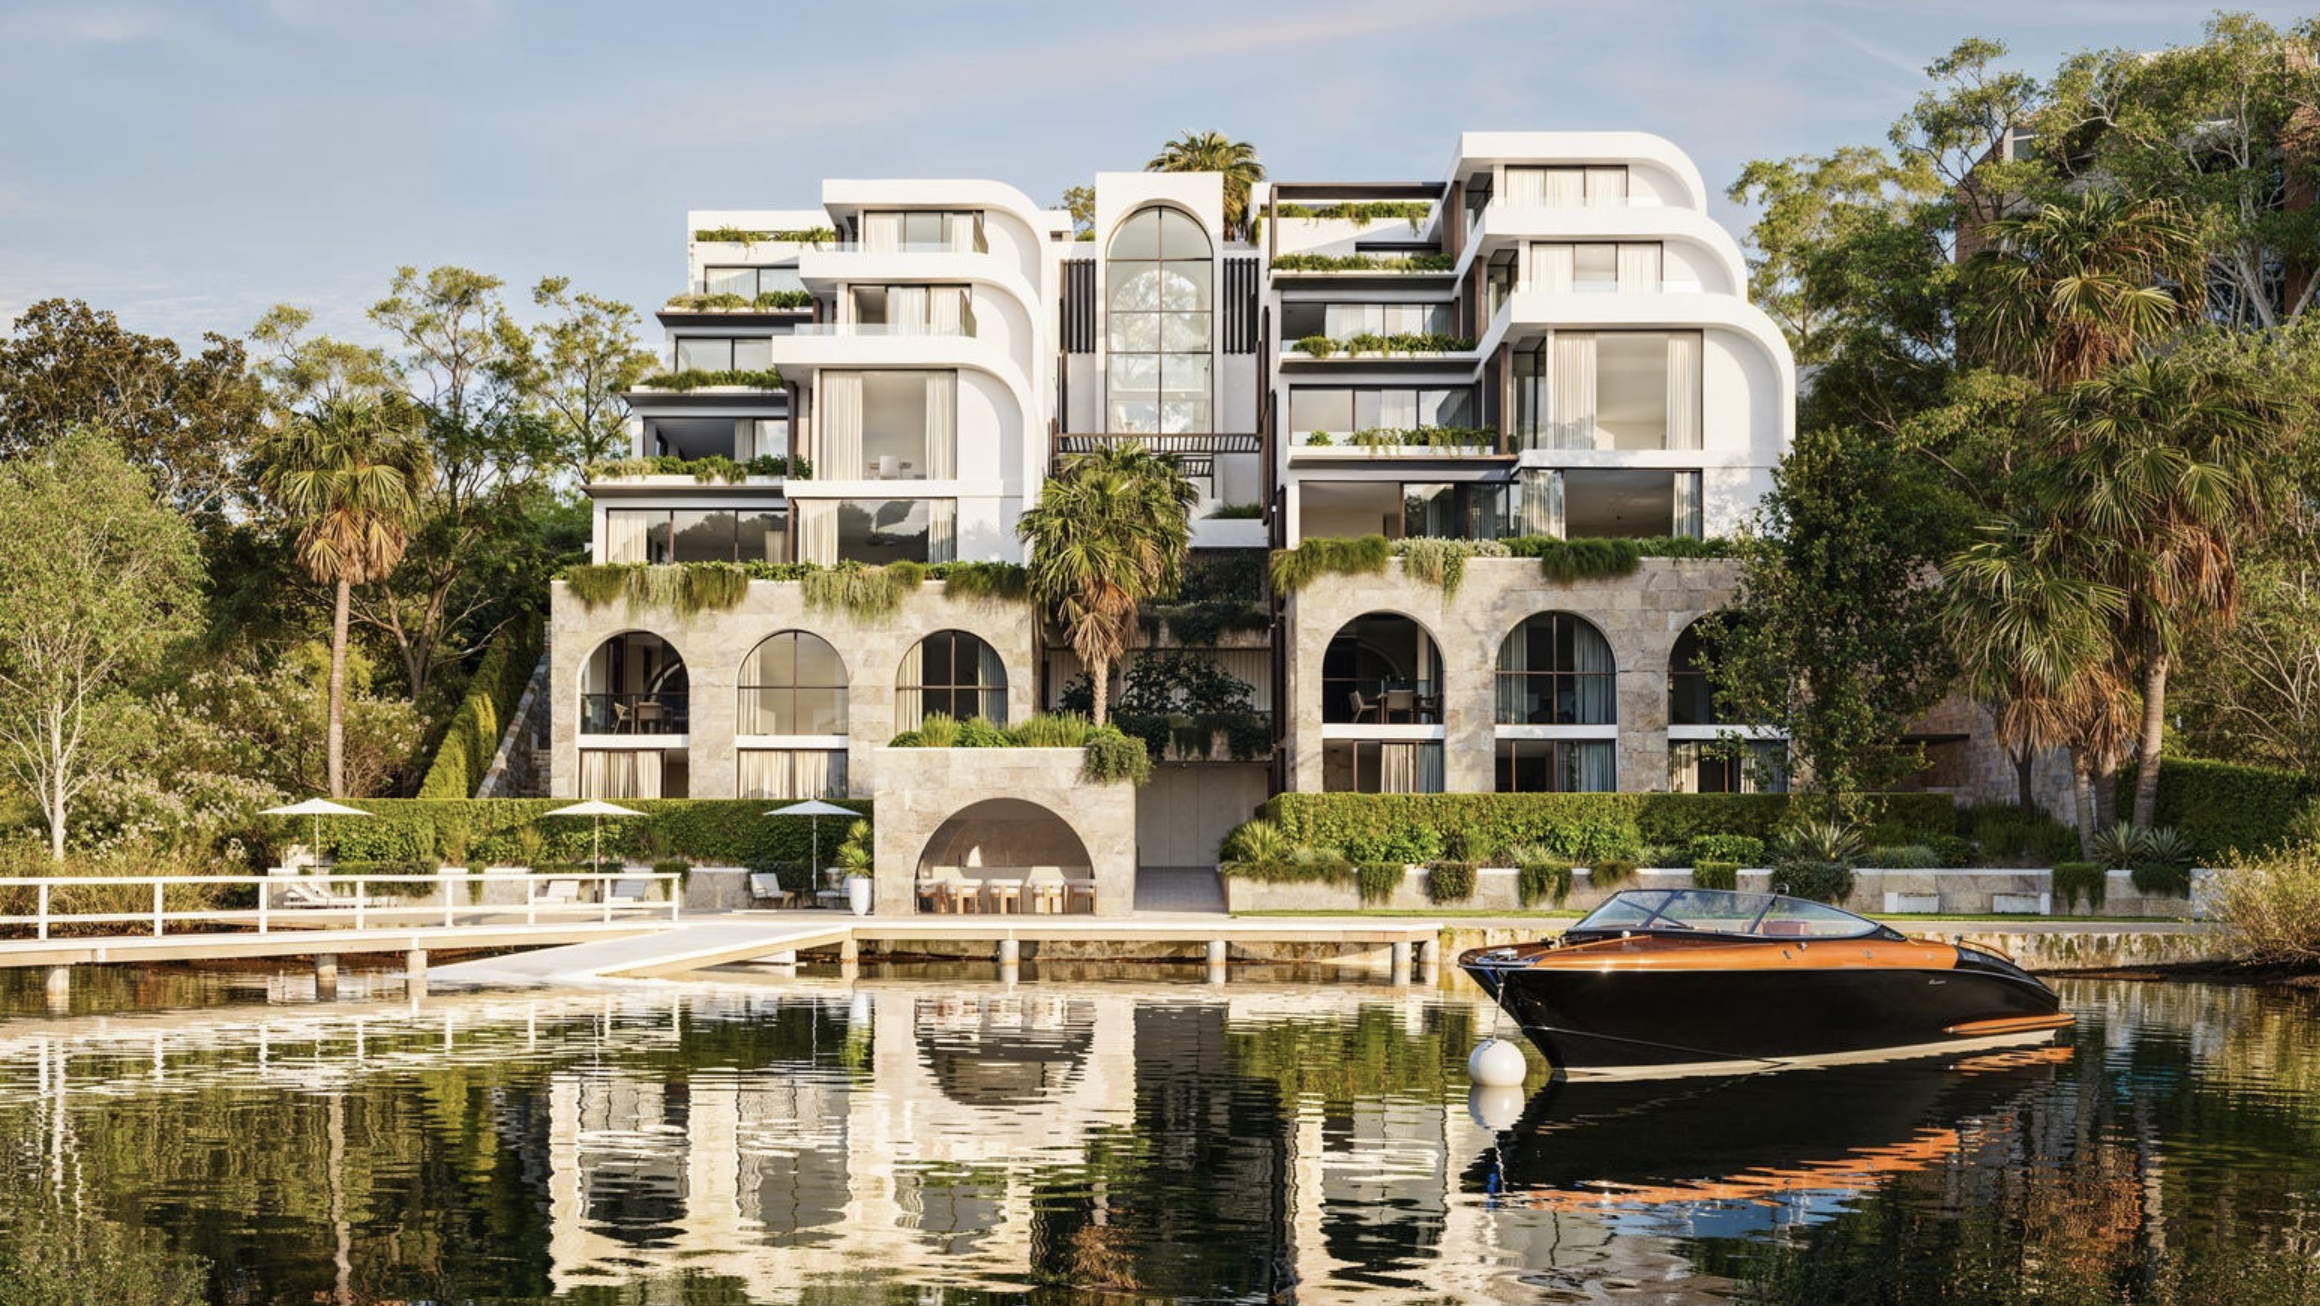
Advertising legend John Singleton unveils an exclusive 16-residence Caroline Bay development, marking his latest high-end property play on the Central Coast.

From office parties to NYE fireworks, here are the bottles that deserve pride of place in the ice bucket this season.