China’s Overcapacity Is Already Backfiring
Excess investment in industry isn’t made up by trading partners, and it has domestic consequences

 2 min
2 min
In the “ China Shock 2.0 ” narrative, not only is China a security threat and a low-end factory competitor, but it is also angling to swamp the West with cut-rate high-tech goods. There has been less focus on the downsides of such a strategy for China itself.
China’s first-quarter growth beat most estimates , rising 5.3% on the year—thanks mostly to strong industrial output and exports. But the economic data released Tuesday also showed that excess capacity is very real, and could be damaging to China itself.
While China’s industrial engine revved up in January and February , it downshifted again in March: output rose just 4.5% on the year, down sharply from January and February’s 7%. More tellingly, manufacturing capacity utilisation plummeted to 73.8% in the first quarter—its weakest, excluding the pandemic-affected first quarter of 2020, since at least 2015. In volume terms, China’s exports hit a nearly 10-year high in March. But in value terms they were barely above where they sat in October.
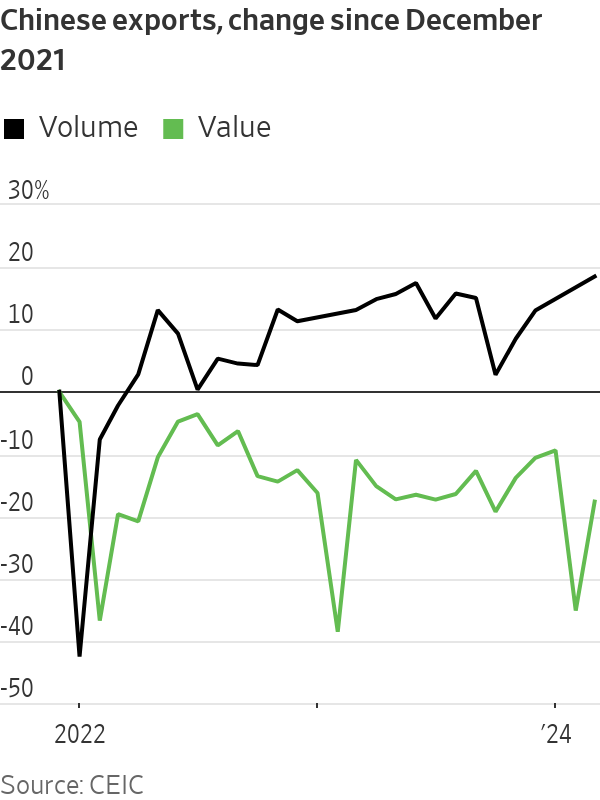
In other words, firms’ pricing power both at home and abroad is weakening and margin pressure is probably mounting: The March industrial financial data, which will be released later this month, will be worth watching.
So will private investment in manufacturing. If external demand, in value terms, doesn’t find a stronger footing soon and China’s domestic economy remains weak, then eventually such investment will need to slow. Otherwise the government, or state-owned banks, will have to start absorbing the cost of too many loans to industry more directly, as they already have with real estate and infrastructure .
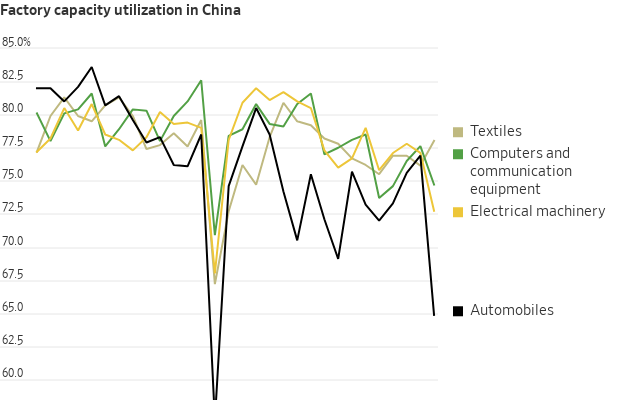
Particularly interesting is the breakdown of that capacity utilisation data itself. Falling run rates were especially obvious in Beijing’s favourite sectors like automobiles and electrical equipment—the so-called “new productive forces,” including electric vehicles, chips and solar panels, which policymakers have highlighted in recent speeches and have been stalking Western politicians’ nightmares. Automobile manufacturing utilisation rates fell below 65% in the first quarter: well below their previous low (excluding the first quarter of 2020) of 69.1% in mid-2016.
China’s traditional export sectors, on the other hand, have actually held up relatively well. Textiles utilisation rose in the first quarter, while run rates for computer and communication gear fell, but much less sharply.
Meanwhile, economy wide borrowing—excluding government bond issuance—weakened further in March, despite bond yields and interest rates near multiyear lows. If margin pressure starts to force some “new productive forces” to start slowing investment, fiscal policy would need to step in to prop up growth.
Alternatively, China can keep funnelling its excess savings into new manufacturing overcapacity—but Chinese banks and Beijing, not just China’s trade partners, will eventually end up footing the bill.
 Copyright 2020, Dow Jones & Company, Inc. All Rights Reserved Worldwide. LEARN MORE





BNW Developments has established a Sydney presence, joining Arada and Sobha Realty among the growing number of UAE developers pursuing Australian buyers and development opportunities.

Australian shares fell on Thursday as Wall Street weakness, rising oil and persistent rate concerns weighed on most of the market. The S&P/ASX 200 declined 0.72 per cent to 8,702. The All Ordinaries lost 0.66 per cent to finish at 8,897. Mining stocks were hit particularly hard, while real estate also dragged on the index. …
Continue reading “ASX falls 0.7 per cent as miners and property stocks retreat”

 2 min
2 minAustralian shares fell on Thursday as Wall Street weakness, rising oil and persistent rate concerns weighed on most of the market.
The S&P/ASX 200 declined 0.72 per cent to 8,702. The All Ordinaries lost 0.66 per cent to finish at 8,897. Mining stocks were hit particularly hard, while real estate also dragged on the index.
Energy was the notable exception, gaining more than one per cent as Brent crude traded above US$103 a barrel. Oil had moved higher amid uncertainty surrounding potential US diesel-export restrictions and broader geopolitical supply risks. The move supported energy producers but renewed concern about inflation inputs across transport and the wider economy.
Gold shares were weak even as spot bullion remained historically elevated. The All Ordinaries Gold index fell about 2.25 per cent, showing that equity performance can diverge from the commodity because of valuation, currency, operating and company-specific factors.
Zip was a prominent loser, falling 11.38 per cent after the company reported short sales after the previous close. Nine Entertainment also weakened after UBS analysts warned of near-term revenue challenges associated with its advertising-supported subscription tier.
Premier Investments led larger winners despite caution about the retail environment. Breville, in which Premier owns a significant stake, also appeared among leading movers. In the broader ASX 300 screen, Myer gained 11.43 per cent and MAAS Group rose 7.93 per cent, while Lotus Resources fell 10.53 per cent. These percentage moves should be checked against company announcements and trading liquidity before attributing causes.
The Australian dollar was broadly flat at US70.38 cents. Spot gold was around US$4,280 an ounce, Brent crude approximately US$103.08 a barrel and iron ore near US$96.90 a tonne late in the session.
The rate outlook remains the central domestic catalyst. Labour-market weakness has not eliminated the possibility of an RBA increase next week, leaving banks, listed property and other rate-sensitive sectors exposed to changing expectations.
Market dashboard
S&P/ASX 200: 8,702, down 0.72 per cent.
All Ordinaries: 8,897, down 0.66 per cent.
Best sector: Energy, up more than one per cent.
Weakest areas: Real estate and materials were the major drags; confirm final sector percentages before publication.
Material winner: Premier Investments led the large-company gainers. Confirm its final closing move from the ASX before publication.
Material loser: Zip, down 11.38 per cent.
ASX 300 percentage leader: Myer, up 11.43 per cent.
ASX 300 percentage laggard: Zip, down 11.38 per cent.
AUD/USD: Approximately US$0.7038, broadly flat.

Borrowers cannot control the Reserve Bank, but they can control how exposed their household budget is to its next decision. The RBA meets on 29 September with inflation concerns still elevated and major-bank economists increasingly bringing forward their rate-rise calls. Fixed mortgage rates have also been moving, reducing the value of waiting for perfect certainty. …
Continue reading “What mortgage holders should do before the next RBA decision”

Ophora Tallawong has launched its final release of quality apartments priced under $700,000.