Stocks Are Crashing—That’s a Great Reason to Sit Tight
The sudden selloff in Japanese equities and a surge in the VIX suggest the current rout is being exaggerated by trend chasers

 4 min
4 min
The red numbers in your 401(k) today might appear to vindicate warnings about an artificial-intelligence bubble and infirm economy. But don’t tilt your portfolio toward full pessimism just yet.
The S&P 500 was down 3% Monday, with the Nasdaq falling even further. Investors have been selling the year’s best performers, concerned that disappointing second-quarter results from big technology companies such as Alphabet , Tesla and Intel are a sign that the AI frenzy is a fad. Also, consumer discretionary stocks have become the worst-performing sector in the S&P 500, as lacklustre labour-market reports have raised worries that the Federal Reserve made a mistake by waiting until September to cut interest rates.
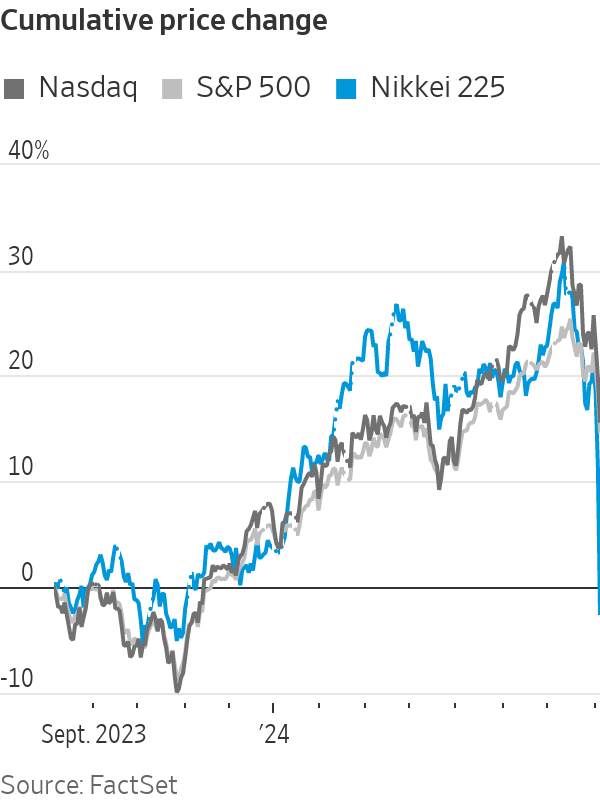
Overseas, the Stoxx Europe 600 closed almost 5% below where it was a week ago, whereas the Swiss franc, a common haven asset, is up roughly 4%. The most eye-popping moves happened in Asia, though, where the Nikkei 225 plunged 12.4% Monday in the worst trading session since Oct. 20, 1987—the day that followed Wall Street’s infamous Black Monday.
Yet it is precisely the breakneck speed with which Japanese equities tumbled that should give most investors a reason to remain calm.
As a guideline, sudden market selloffs are less dangerous than those that unfold progressively over time. This is because investors who rationally price in bad economic data often do so slowly, as it trickles in. Flash crashes, conversely, are often a sign that some tidbit of bad news made speculative bets go awry, triggering a cascade of trades, many of them automated.
Japan is particularly prone to such reversals because interest rates there are so low that many investors use them to fund higher-yielding investments in other currencies. Whenever markets get jittery, these “carry trades” tend to unravel, pushing up the yen and hitting Japanese stocks, many of which are diversified exporters that do better when global growth accelerates. Amplifying this tendency, Japanese stocks had this year become extremely popular among global investors.
The timing of the rout also points a finger at the Bank of Japan , which last week decided to tighten monetary policy for the first time in 17 years with the explicit goal of boosting the yen. Investors who rushed to cover their bets then triggered the reversal of stretched trades elsewhere, including in the U.S.
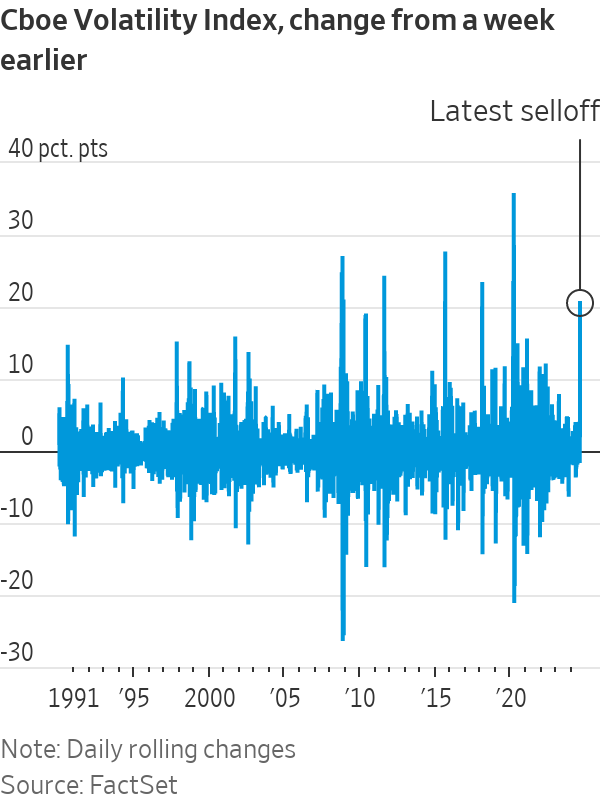
One of the most striking features of the S&P 500 for most of this year has been its extremely low volatility. Until July, the Cboe Volatility Index, or VIX, was at 2019 levels, and kept sliding lower even as investors made big changes to their monetary-policy forecasts.
While the VIX is often dubbed Wall Street’s “fear gauge,” the options contracts it is based on often themselves influence volatility. Whenever investors make bets against market swings, as they have recently in the U.S. by buying lots of structured products , the banks that sell those options are forced to take the other side. These hedges then suppress volatility in the stock market.
The flip side is that whenever a panic breaks through this feedback loop, volatility skyrockets. As the stock market opened Monday, the VIX hovered above 50, making it the highest weekly jump since the onset of the pandemic, though it later fell below 40.
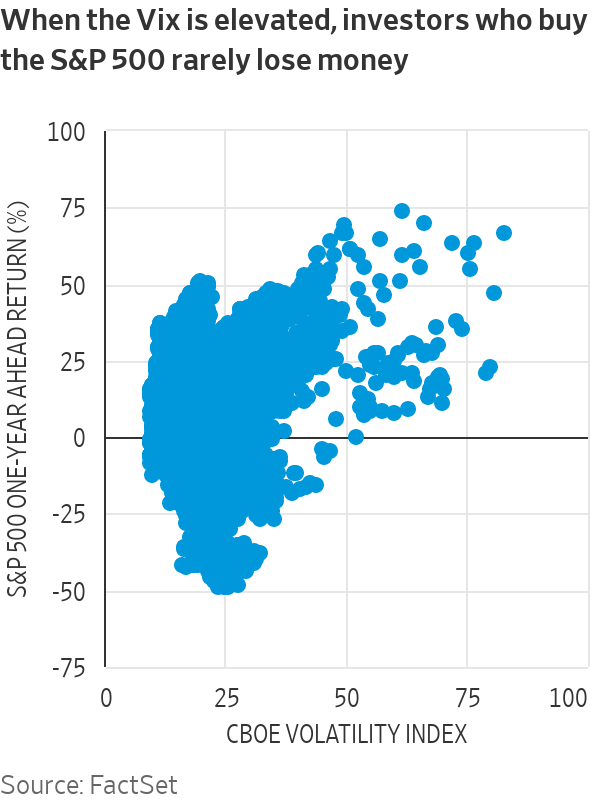
This suggests the selloff is disproportionate, especially looking at the historical record: 87% of the time, investors who bought the S&P 500 on days when the VIX closed at 30 or higher ended up making money a year later.
The second-quarter reporting season has brought mostly good news, with 78% of the S&P 500 firms that have reported so far beating analysts’ earnings estimates—compared with a 74% 10-year average. Both AI-related companies and the rest are reporting net income above what was forecast a month ago. Overall, the U.S. economy still looks robust: The unemployment rate has gone up because the labor force has expanded.
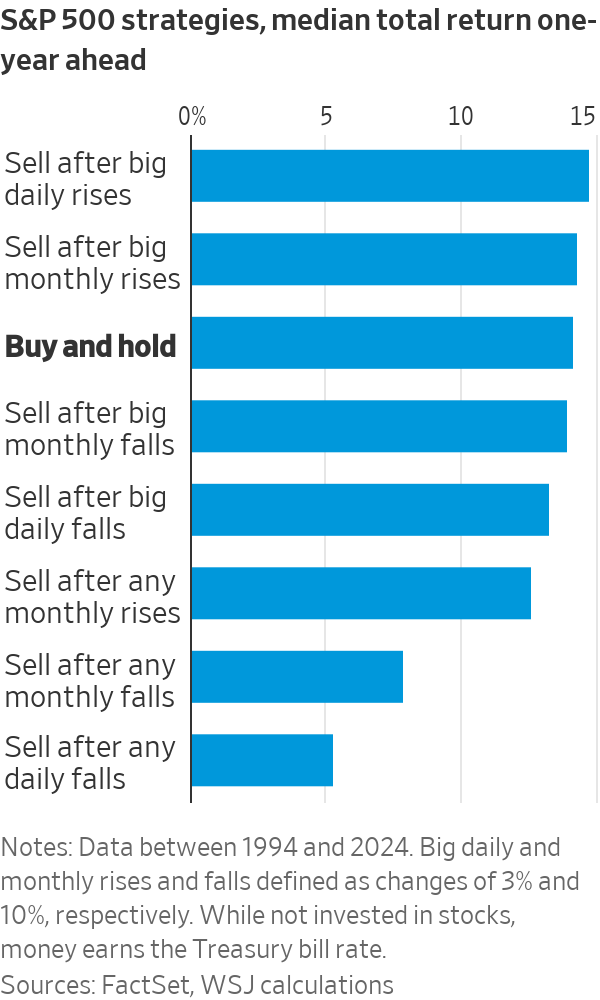
Also, looking at S&P 500 returns since 1994 shows that selling based on the previous day’s falls is a bad strategy. Electing to move into cash after large monthly declines fared better, but still less well than sitting tight.
This isn’t to say that concerns about an economic slowdown or high tech valuations aren’t warranted. Investors have reasons to diversify away from the AI trend or swap more cyclically exposed stocks for more “defensive” names. Indeed, selling out of stocks after particularly exuberant days and months has historically tended to be a winning move. But hindsight is a terrible guide to investing your savings.
 Copyright 2020, Dow Jones & Company, Inc. All Rights Reserved Worldwide. LEARN MORE


From elevated skincare to handcrafted home pieces, this year’s most thoughtful gifts go beyond the expected.

A haven for hedge-fund titans and Hollywood grandees, Greenwich is one of the world’s most expensive residential enclaves, where eye-watering prices meet unapologetic grandeur.


The lunar flyby would be the deepest humans have traveled in space in decades.
4 min
It’s go time for the highest-stakes mission at NASA in more than 50 years.
On April 1, the agency is set to launch four astronauts around the moon, the deepest human spaceflight since the final Apollo lunar landing in 1972.
The launch window for Artemis II , as the mission is called, opens at 6:24 p.m. ET.
National Aeronautics and Space Administration teams have been preparing the vehicles to depart from Florida’s Kennedy Space Center on the planned roughly 10-day trip. Crew members have trained for years for this moment.
Reid Wiseman, the NASA astronaut serving as mission commander, said he doesn’t fear taking the voyage. A widower, he does worry at times about what he is putting his daughters through.
“I could have a very comfortable life for them,” Wiseman said in an interview last September.
“But I’m also a human, and I see the spirit in their eyes that is burning in my soul too. And so we’ve just got to never stop going.”
Wiseman’s crewmates on Artemis II are NASA’s Victor Glover and Christina Koch, as well as Canadian Space Agency astronaut Jeremy Hansen.

What are the goals for Artemis II?
The biggest one: Safely fly the crew on vehicles that have never carried astronauts before.
The towering Space Launch System rocket has the job of lofting a vehicle called Orion into space and on its way to the moon.
Orion is designed to carry the crew around the moon and back. Myriad systems on the ship—life support, communications, navigation—will be tested with the astronauts on board.
SLS and Orion don’t have much flight experience. The vehicles last flew in 2022, when the agency completed its uncrewed Artemis I mission .
How is the mission expected to unfold?
Artemis II will begin when SLS takes off from a launchpad in Florida with Orion stacked on top of it.
The so-called upper stage of SLS will later separate from the main part of the rocket with Orion attached, and use its engine to set up the latter vehicle for a push to the moon.
After Orion separates from the upper stage, it will conduct what is called a translunar injection—the engine firing that commits Orion to soaring out to the moon. It will fly to the moon over the course of a few days and travel around its far side.
Orion will face a tough return home after speeding through space. As it hits Earth’s atmosphere, Orion will be flying at 25,000 miles an hour and face temperatures of 5,000 degrees as it slows down. The capsule is designed to land under parachutes in the Pacific Ocean, not far from San Diego.

Is it possible Artemis II will be delayed?
Yes.
For safety reasons, the agency won’t launch if certain tough weather conditions roll through the Cape Canaveral, Fla., area. Delays caused by technical problems are possible, too. NASA has other dates identified for the mission if it doesn’t begin April 1.
Who are the astronauts flying on Artemis II?
The crew will be led by Wiseman, a retired Navy pilot who completed military deployments before joining NASA’s astronaut corps. He traveled to the International Space Station in 2014.
Two other astronauts will represent NASA during the mission: Glover, an experienced Navy pilot, and Koch, who began her career as an electrical engineer for the agency and once spent a year at a research station in the South Pole. Both have traveled to the space station before.
Hansen is a military pilot who joined Canada’s astronaut corps in 2009. He will be making his first trip to space.
Koch’s participation in Artemis II will mark the first time a woman has flown beyond orbits near Earth. Glover and Hansen will be the first African-American and non-American astronauts, respectively, to do the same.
What will the astronauts do during the flight?
The astronauts will evaluate how Orion flies, practice emergency procedures and capture images of the far side of the moon for scientific and exploration purposes (they may become the first humans to see parts of the far side of the lunar surface). Health-tracking projects of the astronauts are designed to inform future missions.
Those efforts will play out in Orion’s crew module, which has about two minivans worth of living area.
On board, the astronauts will spend about 30 minutes a day exercising, using a device that allows them to do dead lifts, rowing and more. Sleep will come in eight-hour stretches in hammocks.
There is a custom-made warmer for meals, with beef brisket and veggie quiche on the menu.
Each astronaut is permitted two flavored beverages a day, including coffee. The crew will hold one hourlong shared meal each day.
The Universal Waste Management System—that’s the toilet—uses air flow to pull fluid and solid waste away into containers.
What happens after Artemis II?
Assuming it goes well, NASA will march on to Artemis III, scheduled for next year. During that operation, NASA plans to launch Orion with crew members on board and have the ship practice docking with lunar-lander vehicles that Elon Musk’s SpaceX and Jeff Bezos’ Blue Origin have been developing. The rendezvous operations will occur relatively close to Earth.
NASA hopes that its contractors and the agency itself are ready to attempt one or more lunar landing missions in 2028. Many current and former spaceflight officials are skeptical that timeline is feasible.

Formula 1 may be the world’s most glamorous sport, but for Oscar Piastri, it’s also one of the most lucrative. At just 24, Australia’s highest-paid athlete is earning more than US$40 million a year.

New research suggests that bonuses make employees feel more like a mere cog in a wheel.