


Where to Put Your Cash Now for Every Income Level
Rising rates may mean it’s time to put more money in savings accounts, certificates of deposit and Treasury bills

 4 min

Stop dwelling on what you’ve lost thanks to rising interest rates and take advantage of the opportunities they present.
High rates are expected to linger for a while and they are having a corrosive impact on some parts of our finances. Taking out a $500,000 mortgage to buy a home today will cost you about $400 more a month than it would have a year ago in a standard 30-year mortgage. That is not to mention higher rates on credit cards, personal loans and other products for borrowers.
The high-rate periods can also bring juicy, high yields on savings accounts, certificates of deposit and Treasury bills—that is, banks are paying you to let your money sit there. And anyone can take advantage, regardless of income.
Dena Bashri opened a SoFi savings account last fall. It now yields 4.5% a year. She wanted a higher return than she was getting at her local credit union.
Bashri, 25 years old, is a senior director at a fundraising firm and makes roughly $92,500 a year. She saves money on rent by living with her parents in Virginia so she’s able to contribute about $4,900 each month to her savings account. She’s already earned close to a few hundred dollars in interest and hopes to continue building her rainy-day fund, she said.
“Emergency savings offers me the flexibility to take risks but also financially anticipate any life changes that may happen,” Bashri said.
Here’s a financial road map for making the most of great yields while staying on track with your short- and long-term money goals.
Level 1: Nothing to spare
Living paycheck to paycheck is now the norm for most Americans.
Financial advisers urge those holding large amounts of debt to first pay down high-interest balances. About half of people carrying credit-card debt allow those balances to roll over into the next month, according to a recent Bankrate survey.
Credit-card interest rates are at record highs, making that debt even more expensive to maintain. Putting money in a savings account with a 4.5% rate will help little if you haven’t paid down your Visa balance with the current average rate of 22.16%.
“Although you may be able to set aside a certain amount of money in a savings account, if you’re potentially offsetting that with not paying off higher debt, that’s an important consumer consideration,” said Courtney Mitchell, head of consumer deposits, products and payments at TD Bank.
For avid debit-card users, high-yield checking accounts are worth consideration, financial advisers say. These accounts can be found at credit unions and online banks and are yielding up to 6%. That interest can then be linked to a high-yield savings account. This is a good option for debit-card users who want to get a start on their emergency fund.
But try not to keep more than one month’s worth of expenses sitting in a checking account, said Rob Williams, managing director of financial planning and wealth management at Charles Schwab. Research shows money sitting in a checking account is more likely to be spent than money in a savings account.
Level 2: $0—$1,000
For those who can sock away at least a little bit each month, even putting $25 in a high-yield account can make a difference, said Mitchell.
If you contribute $25 a month to a savings account yielding 4.5%, you will have roughly $300 in a year including interest.
Putting that money toward emergency savings? Liquidity is key so that when something unexpected happens, like a flat tire, you can get the money quickly. High-yield savings accounts are the best places for emergency savings because they allow easy withdrawals, financial advisers say.
“You really need emergency savings to be in something you can get at as soon as possible and also without a penalty,” said Mark Hamrik, senior economic analyst at Bankrate.
Financial advisers recommend building up six months to one year of expenses in an emergency-savings account. Homeowners should save a little more for unexpected repairs.
Level 3: $1,000+
Once you’re comfortable with your emergency savings, you can set aside money for holiday gifts, vacations and other short-term goals such as a down payment on a car.
The run of interest rate increases has made certificates of deposit popular again. If you are comfortable locking money away for a period of time, consider a CD for some of these short-term goals. Many six-month to one-year CDs are offering yields above 5%.
It can be helpful to divvy up your high-yield savings for coming expenses.
Erin Confortini, 24, is a freelance marketing consultant based in Pennsylvania who made about $120,000 last year. She has three high-yield savings accounts for her short-term savings goals.
Each month, Confortini puts $150 aside for car insurance, $300 for coming vacations and $200 toward Christmas and birthday gifts, she said.
“It’s really great that now that rates are increasing, we do have an option to earn a little bit of money,” Confortini said.
Level 4: Investing for long term
You’ve got at least one month of expenses in your checking account, you’ve beefed up emergency savings and you’ve set aside buckets of money for anticipated expenses.
Maybe it’s time to get more money out of high-yield savings. Keeping all of your money in savings isn’t a strategy for wealth building because the interest gained on high-yield accounts likely won’t outpace inflation in the long run, said Kyle McBrien, a certified financial planner at Betterment.
One simple way to take advantage of rates and get out of high-yield savings is Treasurys.
Take Victor Cipolla, a 33-year-old entrepreneur in New York.
Cipolla moved $30,000 from his high-yield savings account into a Treasury bill after he noticed that rates were going up. The bill currently yields more than 4% and he reinvests the money in another Treasury bill every six months when it matures, he said. The average yield on a six-month Treasury bill is 5.3%.
“We’ve always had this low interest rate environment, so this is a new area to navigate,” said Cipolla.
 Copyright 2020, Dow Jones & Company, Inc. All Rights Reserved Worldwide. LEARN MORE


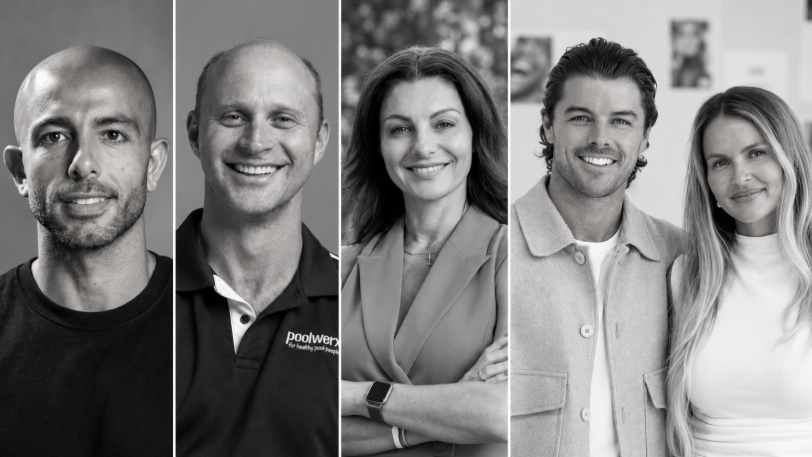
From making unpopular decisions to learning when to listen, leaders from five businesses reveal what nobody prepared them for — and how running a company has challenged their expectations.

Technology and semiconductor shares fell sharply as investors questioned the debt financing the AI infrastructure boom and confronted higher rates and Chinese competition.
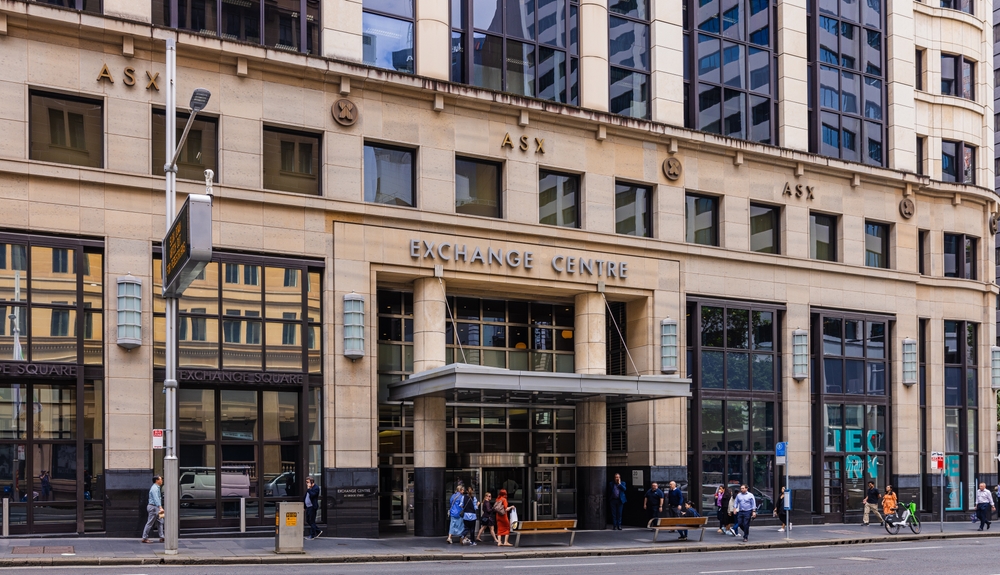
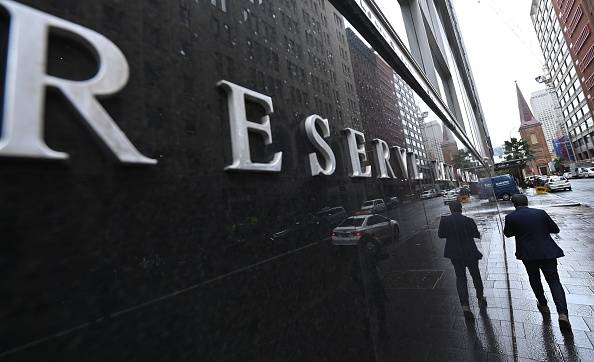
Technology and semiconductor shares fell sharply as investors questioned the debt financing the AI infrastructure boom and confronted higher rates and Chinese competition.
4 minA sharp technology sell-off has exposed a new anxiety on global markets: whether the enormous borrowing behind the artificial-intelligence infrastructure boom can generate sufficient returns as interest rates rise and Chinese competition intensifies.
The artificial-intelligence investment boom has powered technology shares, semiconductor manufacturers and data-centre operators to extraordinary heights. Last week, investors were given a reminder that much of this expansion is being built with borrowed money.
The technology-heavy Nasdaq Composite fell 4.5 per cent over the week ended October 16, its weakest performance since late June. Semiconductor shares suffered an even deeper correction, with the Philadelphia Semiconductor Index losing about 11.4 per cent.
The selling spread quickly through global markets. Micron Technology fell 14.6 per cent over the week, while South Korea’s Samsung Electronics and SK Hynix dropped approximately 18 per cent and 24 per cent respectively.
This was more than a routine bout of profit-taking. Investors were reassessing three interconnected risks: higher interest rates, the rapidly expanding debt burden attached to AI infrastructure and the prospect of stronger competition from Chinese memory-chip manufacturers.
The debt behind the AI build-out
Artificial intelligence requires a physical infrastructure network of enormous scale. Data centres must be built, advanced processors purchased, power supplies secured and cooling systems installed before customers begin generating meaningful revenue from them.
Technology companies are increasingly supplementing their own cash with corporate bonds, syndicated loans, equipment leases, private credit and project-level financing.
JPMorgan describes the emerging funding model as a combination of conventional corporate borrowing and project finance tied to individual data-centre assets. In Australia, the Reserve Bank estimates that syndicated loans accounted for approximately three-quarters of data-centre financing during 2025 and 2026 to date.
The numbers are becoming large enough to affect broader credit markets. The Federal Reserve Bank of Dallas has cited Wall Street estimates suggesting AI-related investment-grade bond issuance could approach US$300 billion in 2026 alone.
That borrowing is not automatically problematic. Debt can be an efficient way to finance long-lived infrastructure when future revenue is sufficiently predictable. The concern is that AI technology, customer demand and computing economics are changing much faster than the repayment schedules attached to the assets.
A data centre financed today may carry debt for years. Investors must therefore make assumptions about future utilisation rates, electricity prices, chip performance, customer concentration and the amount businesses will ultimately pay for AI computing.
When interest rates rise, those assumptions become less forgiving.
Inflation changes the calculation
September’s US inflation data intensified the pressure. Consumer prices increased 3.7 per cent over the year, ahead of market expectations and up from 3.4 per cent in August.
The hotter reading reduced confidence that interest rates would fall quickly and pushed bond yields higher. That matters particularly for companies whose valuations depend on profits expected well into the future, as well as highly leveraged infrastructure operators that may need to refinance.
CoreWeave has emerged as a closely watched test case. The specialist cloud-computing company has accumulated substantial debt and lease obligations to build AI capacity, while relying on a concentrated group of large technology customers.
Its shares fell sharply during the sell-off, while the cost of insuring its debt against default climbed. CoreWeave has argued that its contracted backlog more than covers its obligations and that financial markets do not always understand its business model. Nevertheless, its securities have become a proxy for investor confidence in debt-funded AI infrastructure.
Oracle, another major investor in AI computing capacity, fell 8.8 per cent in Friday trading, while CoreWeave dropped 15.5 per cent.
The question is shifting from how much AI infrastructure can be built to how profitably it can be operated.
China adds another source of pressure
Interest rates were not the only catalyst. Reports of advances by Chinese memory-chip producer ChangXin Memory Technologies raised concerns that lower-cost Chinese products could increase competition across the global semiconductor industry.
Memory chips are essential to AI systems, but the industry is historically cyclical. Periods of tight supply and high pricing can encourage rapid investment, eventually producing oversupply and falling margins.
The prospect of a well-funded Chinese competitor expanding its technological capabilities unsettled investors in Samsung, SK Hynix and Micron. It also demonstrated that AI-related demand does not insulate chipmakers from conventional competitive pressures.
That combination—slower rate cuts, more expensive financing and potentially cheaper supply—challenged the assumption that every company exposed to AI would enjoy continually expanding margins.
A reset rather than the end of the boom
The sell-off does not establish that the AI boom is ending. Demand for computing power remains strong, the largest technology companies continue to generate formidable cash flows and many infrastructure projects are backed by long-term customer contracts.
What has changed is the market’s willingness to overlook the price and financing structure of that growth.
The most resilient companies are likely to be those able to fund investment from operating cash flow, secure long-duration customers and demonstrate that new capacity will earn returns comfortably above its financing costs.
More speculative operators may face greater scrutiny, particularly where debt is expensive, customers are concentrated or expected revenue depends on demand that has not yet materialised.
For Australian investors, the lesson extends beyond US technology shares. Local data-centre operators, infrastructure funds, electricity suppliers and property groups are increasingly exposed to the same investment cycle.
Artificial intelligence may remain one of the defining growth themes of the decade. But last week’s correction showed that enthusiasm for the technology does not eliminate financial discipline.
The next stage of the AI boom will be judged not only by computing power, model performance or demand for chips, but by something more traditional: whether the assets being financed can generate enough cash to repay the money borrowed to build them.
Fact box
Nasdaq Composite: Down 4.5 per cent for the week ended October 16, 2026
Philadelphia Semiconductor Index: Down approximately 11.4 per cent
Micron Technology: Down approximately 14.6 per cent
Samsung Electronics: Down approximately 18 per cent
SK Hynix: Down approximately 24 per cent
US September inflation: 3.7 per cent annually
Estimated 2026 AI-related investment-grade issuance: Approximately US$300 billion

International AI strategist Justin Kabbani will headline the Kanebridge Property Summit in Sydney on June 18, with tickets selling fast.

Porsche has revealed a one-off 911 GT2 RS that brings the extraordinary silhouette of its 935/78 “Moby Dick” racing car onto the road. Created by Porsche Sonderwunsch with Manthey, the commission began with a near-new GT2 RS. The owner requested greater performance, a Slantnose profile and a rear wing influenced by the limited 911 GT3 …
Continue reading “Porsche Builds a Road-Going “Moby Dick” From a 911 GT2 RS”