


Inflation Sits at 8.2% as Core Prices Hit Four-Decade High
Consumer-price index’s rise eased slightly in September but core index marked biggest increase since 1982

 4 min
4 min
U.S. consumer inflation excluding energy and food accelerated to a new four-decade high in September, a sign that strong and broad price pressures are persisting.
The Labor Department on Thursday said that its so-called core consumer-price index—which excludes volatile energy and food prices—rose 6.6% in September from a year earlier, the biggest increase since August 1982. The measure increased 6.3% in August.
The inflation report likely keeps the Federal Reserve on track to increase interest rates by 0.75 percentage point at its meeting next month. It also raises the risk officials will delay an anticipated slowdown in the pace of rate rises after that or signal that they are likely to raise rates to even higher levels early next year than previously anticipated by policy makers and investors.
U.S. stocks fell in early trading before recovering. Treasury yields rose.
Prices rose last month for housing, medical care, airline fares and other services, threatening to keep inflation high for a while.
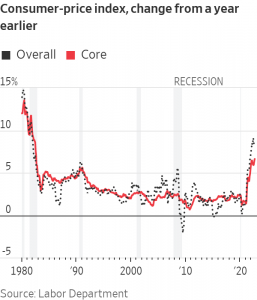
Investors and policy makers follow core inflation closely as a reflection of broad, underlying inflation and as a predictor of future inflation. On a monthly basis, the core CPI rose 0.6% in September, the same as in August, and up from 0.3% in July.
“Inflation has built up a lot of momentum over the last year,” said Bill Adams, chief economist at Comerica Bank. “That’s going to keep inflation higher than the Federal Reserve wants it for at least a couple more months—if not a couple more quarters.”
The overall CPI increased 8.2% in September from the same month a year ago, pulled down by a drop in gasoline prices that was partially offset by higher food costs. The reading was down from 8.3% in August and 9.1% in June, which was the highest inflation rate in four decades. The CPI measures what consumers pay for goods and services.
Housing costs rose by the most since the early 1980s, as a strong labour market continues to push up rental rates. The housing-cost indexes make up two-fifths of the core index and tend to move slowly, since the leases that they are based on are typically negotiated once a year. That lag means housing costs could keep core CPI high for months, even though private-sector rent measures are declining.
Core services prices, which tend to persist once they start rising, rose at a one-month annualised rate of 9.9%, the sharpest rate since 1982. Prices for motor vehicle repair services rose 2.2% in September from the prior month. Veterinary services and daycare and preschool increased 2% last month
Mr. Adams said those figures reflected “the ripple effects of price shocks over the last year broadening across the economy.”
The Social Security Administration separately said Thursday that Social Security benefits would increase by 8.7% in 2023. The boost, calculated from a different version of the September CPI, is the highest in four decades.
The increase will translate to a sizeable income increase for around 70 million people, compared with workers who aren’t seeing wage growth that keeps pace with inflation, said James Knightley, chief international economist at ING.
Mr. Knightly said the benefits increase could put slight pressure on inflation next year.
Inflation accelerated last year as the U.S. economy recovered from the Covid-19 pandemic. Prices rose as strong consumer demand—stoked by lower interest rates and government stimulus—collided with constrained supply chains and pandemic-related shortages. Russia’s invasion of Ukraine this year further spurred inflation worldwide, hitting food, energy and other commodity prices.
The U.S. growth outlook has dimmed, and the higher interest rates are stoking fears of a recession. Gross domestic product, a broad measure of spending on goods and services, fell at an annual rate of 1.1% in the first half of the year, adjusted for inflation and seasonality.
The Fed is aggressively raising interest rates to slow price increases. Officials at the Fed’s September policy meeting expressed concern about the persistence of high inflation, minutes published this week showed.
Officials last month raised the benchmark federal-funds rate by 0.75 percentage point—their fifth increase since March—bringing it to a range between 3% and 3.25%, the most rapid pace of rate increases since the early 1980s.
Fed Chairman Jerome Powell said in late September that the central bank would continue to lift interest rates and keep them high until it is certain that inflation has been tamed. Nearly all Fed officials expect to raise their benchmark interest rate to between 4% and 4.5% by the end of this year, according to September projections.
“You don’t get inflation like this without a lot of things going wrong,” said Michael Gapen, head of U.S. economics at Bank of America. “Maybe the bumper sticker is: It’s not just up to the Fed to bring inflation down. We expect help from other areas including global commodity markets and a reversal in the relative shock to core goods prices.”
A deceleration in price increases for autos, furniture and other goods is key to putting inflation on a steady downtrend, Mr. Gapen said. There are signs that pressures created by supply-chain disruptions could be subsiding, helped by a consumer shift from spending on goods to services. Prices for core consumer goods remained flat from August to September as well, in part due to a drop in used-auto prices.
Food prices have continued to climb. Grocery prices increased 13% from a year ago in September, buoyed in part by a 30.5% surge in prices for eggs and a 24.2% increase in those for flour and mixes.
Kristin Curreri of Arlington, Mass., said high inflation is making it hard to manage finances since she got married in May 2021. She and her husband expanded their wedding guest list and increased their budget after Covid-related restrictions eased, leading to a credit-card balance.
“Inflation wasn’t something people were paying attention to at that point,” she said. “This was the first gathering people got to go to in a year, so I thought, ‘Well, let’s pay a little more and carry a little debt that I’ll then pay off.’”
Then prices started shooting up, with higher food costs particularly punishing. While Ms. Curreri said she has cut back on more-expensive items including organic chicken, she estimates that her overall grocery bill has gone up around 30% since 2021.
“With the cost of living having increased so much, I’ve basically been carrying a rolling four grand that I just can’t get rid of,” she said, referring to her credit-card balance.
 Copyright 2020, Dow Jones & Company, Inc. All Rights Reserved Worldwide. LEARN MORE


This stylish family home combines a classic palette and finishes with a flexible floorplan

Just 55 minutes from Sydney, make this your creative getaway located in the majestic Hawkesbury region.


New research suggests spending 40 percent of household income on loan repayments is the new normal
3 min
Requiring more than 30 percent of household income to service a home loan has long been considered the benchmark for ‘housing stress’. Yet research shows it is becoming the new normal. The 2024 ANZ CoreLogic Housing Affordability Report reveals home loans on only 17 percent of homes are ‘serviceable’ if serviceability is limited to 30 percent of the median national household income.
Based on 40 percent of household income, just 37 percent of properties would be serviceable on a mortgage covering 80 percent of the purchase price. ANZ CoreLogic suggest 40 may be the new 30 when it comes to home loan serviceability. “Looking ahead, there is little prospect for the mortgage serviceability indicator to move back into the 30 percent range any time soon,” says the report.
“This is because the cash rate is not expected to be cut until late 2024, and home values have continued to rise, even amid relatively high interest rate settings.” ANZ CoreLogic estimate that home loan rates would have to fall to about 4.7 percent to bring serviceability under 40 percent.
CoreLogic has broken down the actual household income required to service a home loan on a 6.27 percent interest rate for an 80 percent loan based on current median house and unit values in each capital city. As expected, affordability is worst in the most expensive property market, Sydney.
Sydney
Sydney’s median house price is $1,414,229 and the median unit price is $839,344.
Based on 40 percent serviceability, households need a total income of $211,456 to afford a home loan for a house and $125,499 for a unit. The city’s actual median household income is $120,554.
Melbourne
Melbourne’s median house price is $935,049 and the median apartment price is $612,906.
Based on 40 percent serviceability, households need a total income of $139,809 to afford a home loan for a house and $91,642 for a unit. The city’s actual median household income is $110,324.
Brisbane
Brisbane’s median house price is $909,988 and the median unit price is $587,793.
Based on 40 percent serviceability, households need a total income of $136,062 to afford a home loan for a house and $87,887 for a unit. The city’s actual median household income is $107,243.
Adelaide
Adelaide’s median house price is $785,971 and the median apartment price is $504,799.
Based on 40 percent serviceability, households need a total income of $117,519 to afford a home loan for a house and $75,478 for a unit. The city’s actual median household income is $89,806.
Perth
Perth’s median house price is $735,276 and the median unit price is $495,360.
Based on 40 percent serviceability, households need a total income of $109,939 to afford a home loan for a house and $74,066 for a unit. The city’s actual median household income is $108,057.
Hobart
Hobart’s median house price is $692,951 and the median apartment price is $522,258.
Based on 40 percent serviceability, households need a total income of $103,610 to afford a home loan for a house and $78,088 for a unit. The city’s actual median household income is $89,515.
Darwin
Darwin’s median house price is $573,498 and the median unit price is $367,716.
Based on 40 percent serviceability, households need a total income of $85,750 to afford a home loan for a house and $54,981 for a unit. The city’s actual median household income is $126,193.
Canberra
Canberra’s median house price is $964,136 and the median apartment price is $585,057.
Based on 40 percent serviceability, households need a total income of $144,158 to afford a home loan for a house and $87,478 for a unit. The city’s actual median household income is $137,760.

Consumers are going to gravitate toward applications powered by the buzzy new technology, analyst Michael Wolf predicts
This stylish family home combines a classic palette and finishes with a flexible floorplan