There’s a China-Shaped Hole in the Global Economy
China’s low-consuming, high-investing economy guarantees conflict with other countries

 4 min
4 min
China’s economy is unusual. Whereas consumers contribute 50% to 75% of gross domestic product in other major economies, in China they account for 40%. Investment, such as in property, infrastructure and factories, and exports provide most of the rest.
Lately, that low consumption has become a headwind to China’s growth because property investment, once a major component of demand, has collapsed.
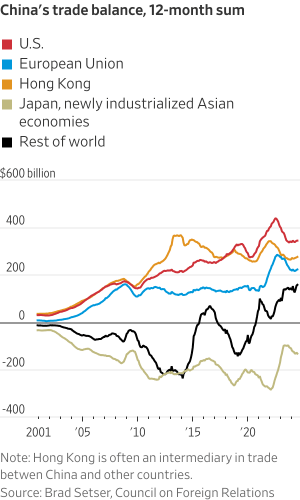
This isn’t just a problem for China; it’s a problem for the whole world. What Chinese companies can’t sell to Chinese consumers, they export. The result: an annual trade surplus in goods now of almost $900 billion, or 0.8% of global gross domestic product. That surplus effectively requires other countries to run trade deficits.
China’s surplus, long a sore spot in the U.S., increasingly is one elsewhere, too. While China’s 12-month trade balance with the U.S. has risen by $49 billion since 2019, it’s up $72 billion with the European Union, $74 billion with Japan and Asia’s newly industrialised economies, and about $240 billion with the rest of the world, according to data compiled by Brad Setser of the Council on Foreign Relations.
Logan Wright , head of China research at Rhodium Group, a U.S. research firm, said China accounts for just 13% of the world’s consumption but 28% of its investment. That investment only makes sense if China takes market share away from other countries, rendering their own manufacturing investment unviable, he said.
“China’s growth model is dependent at this point on a more confrontational approach with the rest of the world,” he said.
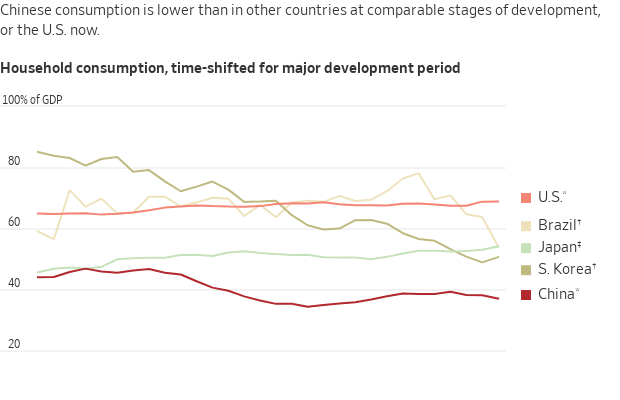
While many developing countries relied on investment and exports to fuel early growth, China is an outlier for how low its consumption is, and its sheer size. In a report, Rhodium estimates that if China’s consumption share equaled that of the European Union or Japan, its annual household spending would be $9 trillion instead of $6.7 trillion. That $2.3 trillion difference—roughly the GDP of Italy—is equal to a 2% hole in global demand.
The sources of this underconsumption are deeply embedded in both China’s fiscal systems and its policy choices.
Chinese incomes are highly unequal, and because the rich spend less of their income than the poor, this automatically depresses consumption. Rhodium cites data that says the top 10% of households had 69% of total savings, while a third had negative saving rates.
Other countries address such disparities by taxing the rich more heavily and boosting the spending power of lower and middle classes through cash transfers, and public health and education. China does much less of this. Just 8% of its tax revenue comes from personal income taxes, compared with 38% from value-added taxes, similar to sales taxes, which fall much more heavily on lower-income families, Rhodium estimates.
China also spends less on health and education than major market economies, forcing poor and middle-income families to spend more of their disposable income on both.
Meanwhile, suppressed wages and interest rates depress household income and spending while boosting the profits of state-owned enterprises. The limited taxing authority of local governments forces them to raise revenue by selling property for manufacturing and infrastructure, which further inflates investment.
A decade ago top Chinese policymakers shared Western economists’ perspective that, at the macro level, China needed to rebalance away from investment to consumption. In 2013, the ruling Communist Party said growth would henceforth rely on market forces and consumers.
President Xi Jinping ended up going in the opposite direction; consumption stayed weak while state control over the economy grew. He has replaced reformers with loyalists more preoccupied with sector-specific targets than overall growth.
The bedrock principle behind trade is comparative advantage: countries specialise in what they do best and then export it in exchange for imports. Xi rejects this principle. In pursuit of “independence and self-reliance,” he wants China to make as much and import as little as possible.
Officials in China boast that it is the “only country to produce in every single one of the United Nations’ industrial product categories,” notes Andrew Batson of Gavekal Dragonomics.
Even as China targets advanced products such as electric vehicles and semiconductors, it refuses to surrender market share in lower-value products: “Establish the new before breaking the old,” Xi has instructed his bureaucrats , my colleagues have reported.
As a result, Rhodium argues , “China provides fewer opportunities as an export market for emerging countries while competing head-on with them in the low-tech and mid-tech space.”
Countries that once saw China as a customer now see a competitor. “Many Chinese businesses are manufacturing intermediate goods, which we mainly export,” Rhee Chang-yong , the governor of the Bank of Korea, said last year. “The decadelong support from the Chinese economic boom has disappeared.”
Mexican Finance Minister Rogelio Ramírez de la O complained last month , “China sells to us but doesn’t buy from us and that’s not reciprocal trade.”
Ironically, foreign officials have tended to see the U.S. as the biggest threat to the world trade system, ever since President Donald Trump in 2018 imposed steep tariffs on China and narrower tariffs on other trading partners. He has promised to expand those tariffs if elected this fall.
And yet Trump’s tariffs should be seen as a reaction to China’s beggar-thy-neighbour economic model, one that has proved impervious to existing trade rules.
Still, no single country can fix the problem. Like a dike deflecting floodwaters, U.S. tariffs have diverted Chinese exports to other markets.
Those other countries are now taking action. Mexico, Chile, Indonesia and Turkey have all announced or said they are considering tariffs on China this year. This week Canada announced steep new tariffs on Chinese electric vehicles, steel and aluminum, aligning with those already announced by the U.S.
Yet the world thus far lacks a unified solution to Chinese underconsumption, because China refuses to accept that it’s a problem.
Xi has rejected fiscal support for households as “welfarism” that breeds laziness. In April, Treasury Secretary Janet Yellen complained that China’s “weak household consumption and business overinvestment” were threatening jobs in the U.S. The state news agency Xinhua called it a pretext for protectionism. Earlier this month the International Monetary Fund advised Beijing to spend 5.5% of GDP over four years buying up uncompleted homes. Beijing politely declined.
With China dug in, more friction is sure to follow, and an already fragile world trading system will be stressed to its breaking point.
 Copyright 2020, Dow Jones & Company, Inc. All Rights Reserved Worldwide. LEARN MORE


A divide has opened in the tech job market between those with artificial-intelligence skills and everyone else.

A 30-metre masterpiece unveiled in Monaco brings Lamborghini’s supercar drama to the high seas, powered by 7,600 horsepower and unmistakable Italian design.


A divide has opened in the tech job market between those with artificial-intelligence skills and everyone else.
4 minThere has rarely, if ever, been so much tech talent available in the job market. Yet many tech companies say good help is hard to find.
What gives?
U.S. colleges more than doubled the number of computer-science degrees awarded from 2013 to 2022, according to federal data. Then came round after round of layoffs at Google, Meta, Amazon, and others.
The Bureau of Labor Statistics predicts businesses will employ 6% fewer computer programmers in 2034 than they did last year.
All of this should, in theory, mean there is an ample supply of eager, capable engineers ready for hire.
But in their feverish pursuit of artificial-intelligence supremacy, employers say there aren’t enough people with the most in-demand skills. The few perceived as AI savants can command multimillion-dollar pay packages. On a second tier of AI savvy, workers can rake in close to $1 million a year .
Landing a job is tough for most everyone else.
Frustrated job seekers contend businesses could expand the AI talent pipeline with a little imagination. The argument is companies should accept that relatively few people have AI-specific experience because the technology is so new. They ought to focus on identifying candidates with transferable skills and let those people learn on the job.
Often, though, companies seem to hold out for dream candidates with deep backgrounds in machine learning. Many AI-related roles go unfilled for weeks or months—or get taken off job boards only to be reposted soon after.
Playing a different game
It is difficult to define what makes an AI all-star, but I’m sorry to report that it’s probably not whatever you’re doing.
Maybe you’re learning how to work more efficiently with the aid of ChatGPT and its robotic brethren. Perhaps you’re taking one of those innumerable AI certificate courses.
You might as well be playing pickup basketball at your local YMCA in hopes of being signed by the Los Angeles Lakers. The AI minds that companies truly covet are almost as rare as professional athletes.
“We’re talking about hundreds of people in the world, at the most,” says Cristóbal Valenzuela, chief executive of Runway, which makes AI image and video tools.
He describes it like this: Picture an AI model as a machine with 1,000 dials. The goal is to train the machine to detect patterns and predict outcomes. To do this, you have to feed it reams of data and know which dials to adjust—and by how much.
The universe of people with the right touch is confined to those with uncanny intuition, genius-level smarts or the foresight (possibly luck) to go into AI many years ago, before it was all the rage.
As a venture-backed startup with about 120 employees, Runway doesn’t necessarily vie with Silicon Valley giants for the AI job market’s version of LeBron James. But when I spoke with Valenzuela recently, his company was advertising base salaries of up to $440,000 for an engineering manager and $490,000 for a director of machine learning.
A job listing like one of these might attract 2,000 applicants in a week, Valenzuela says, and there is a decent chance he won’t pick any of them. A lot of people who claim to be AI literate merely produce “workslop”—generic, low-quality material. He spends a lot of time reading academic journals and browsing GitHub portfolios, and recruiting people whose work impresses him.
In addition to an uncommon skill set, companies trying to win in the hypercompetitive AI arena are scouting for commitment bordering on fanaticism .
Daniel Park is seeking three new members for his nine-person startup. He says he will wait a year or longer if that’s what it takes to fill roles with advertised base salaries of up to $500,000.
He’s looking for “prodigies” willing to work seven days a week. Much of the team lives together in a six-bedroom house in San Francisco.
If this sounds like a lonely existence, Park’s team members may be able to solve their own problem. His company, Pickle, aims to develop personalised AI companions akin to Tony Stark’s Jarvis in “Iron Man.”
Overlooked
James Strawn wasn’t an AI early adopter, and the father of two teenagers doesn’t want to sacrifice his personal life for a job. He is beginning to wonder whether there is still a place for people like him in the tech sector.
He was laid off over the summer after 25 years at Adobe , where he was a senior software quality-assurance engineer. Strawn, 55, started as a contractor and recalls his hiring as a leap of faith by the company.
He had been an artist and graphic designer. The managers who interviewed him figured he could use that background to help make Illustrator and other Adobe software more user-friendly.
Looking for work now, he doesn’t see the same willingness by companies to take a chance on someone whose résumé isn’t a perfect match to the job description. He’s had one interview since his layoff.
“I always thought my years of experience at a high-profile company would at least be enough to get me interviews where I could explain how I could contribute,” says Strawn, who is taking foundational AI courses. “It’s just not like that.”
The trouble for people starting out in AI—whether recent grads or job switchers like Strawn—is that companies see them as a dime a dozen.
“There’s this AI arms race, and the fact of the matter is entry-level people aren’t going to help you win it,” says Matt Massucci, CEO of the tech recruiting firm Hirewell. “There’s this concept of the 10x engineer—the one engineer who can do the work of 10. That’s what companies are really leaning into and paying for.”
He adds that companies can automate some low-level engineering tasks, which frees up more money to throw at high-end talent.
It’s a dynamic that creates a few handsomely paid haves and a lot more have-nots.

Micro-needling promises glow and firmness, but timing can make all the difference.

On October 2, acclaimed chef Dan Arnold will host an exclusive evening, unveiling a Michelin-inspired menu in a rare masterclass of food, storytelling and flavour.