Where Do Economists Think We’re Headed? These Are Their Predictions
WSJ’s latest quarterly survey shows economists’ expectations for growth, inflation and interest rates

 2 min
2 min
The Wall Street Journal’s latest quarterly survey of business and academic economists shows forecasters remain firmly optimistic about the economic outlook, despite some hints of weakness in recent data.
The following graphics show what economists are thinking now and how their forecasts—and the economy—have evolved over recent months and years. After looking at the charts, see if you can guess how economists answered questions about when the Federal Reserve will cut interest rates and how the election could affect the deficit, inflation and interest rates.
Welcoming normalisation
For about two years, economists consistently underestimated the strength of the U.S. economy, forecasting the economy would grow slower than it did.
That changed recently when growth was lower than expected in the first three months of the year. Still, most economists believe that a slowdown was inevitable after a period of rapid expansion and too-high inflation. The economy, they argue, is normalising rather than deteriorating.
Seeing no acceleration in unemployment
In another shift, the unemployment rate has also recently climbed a little faster than economists were expecting—rising to 4.1% in June from 3.4% in early 2023.
Demand for workers seems to be cooling even as job growth remains solid, thanks in part to increased immigration. Again, economists are optimistic that this represents a return to a more stable environment.
Slow but steady progress on inflation
The Journal’s latest survey of economists concluded July 9, two days before consumer-price index data showed inflation easing substantially in June. That may partially explain why inflation forecasts nudged a bit higher since the last survey in early April.
The difference, though, is marginal. Current forecasts—like previous forecasts—show strong confidence that the Fed will succeed in bringing inflation down to its 2% target. The question has been what it would take to get there.
Higher-for-longer interest rates
The recent uptick in the unemployment rate and decline in inflation has rekindled hopes among investors that the Fed could cut short-term interest rates as many as three times this year—starting most likely in September.
Still, the recent good news on inflation has only come after a series of disappointing readings, including one that came out just after the April survey was conducted. As a result, the latest survey of economists shows a slightly higher path for rates.
Economists’ optimistic outlook can be seen in the dispersion of rate forecasts. The Fed would likely cut rates more aggressively if it were worried about a recession . However, 22% of survey respondents think that rates will fall below 3.75% by June 2025—down slightly from 25% of respondents in April.
Test yourself against the economists
We asked survey respondents a number of questions on the economy. Select an answer to see how economists responded.
In their own words
Here’s what some of the survey respondents said about the economy.
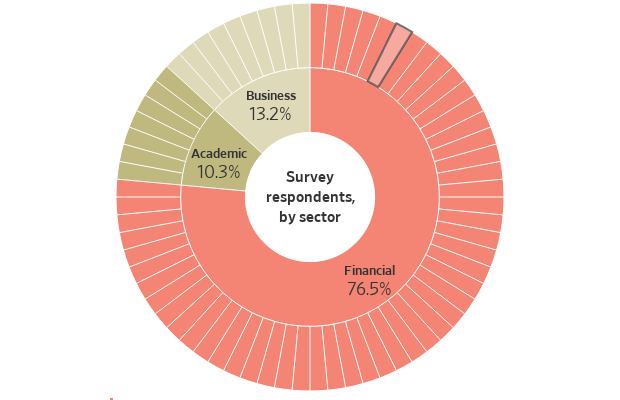
Who participates
The Wall Street survey has been publishing consensus forecasts from a panel of academic, business and financial economists for nearly 40 years. Not every economist answers every question.
 Copyright 2020, Dow Jones & Company, Inc. All Rights Reserved Worldwide. LEARN MORE


A divide has opened in the tech job market between those with artificial-intelligence skills and everyone else.

A 30-metre masterpiece unveiled in Monaco brings Lamborghini’s supercar drama to the high seas, powered by 7,600 horsepower and unmistakable Italian design.


A divide has opened in the tech job market between those with artificial-intelligence skills and everyone else.
4 minThere has rarely, if ever, been so much tech talent available in the job market. Yet many tech companies say good help is hard to find.
What gives?
U.S. colleges more than doubled the number of computer-science degrees awarded from 2013 to 2022, according to federal data. Then came round after round of layoffs at Google, Meta, Amazon, and others.
The Bureau of Labor Statistics predicts businesses will employ 6% fewer computer programmers in 2034 than they did last year.
All of this should, in theory, mean there is an ample supply of eager, capable engineers ready for hire.
But in their feverish pursuit of artificial-intelligence supremacy, employers say there aren’t enough people with the most in-demand skills. The few perceived as AI savants can command multimillion-dollar pay packages. On a second tier of AI savvy, workers can rake in close to $1 million a year .
Landing a job is tough for most everyone else.
Frustrated job seekers contend businesses could expand the AI talent pipeline with a little imagination. The argument is companies should accept that relatively few people have AI-specific experience because the technology is so new. They ought to focus on identifying candidates with transferable skills and let those people learn on the job.
Often, though, companies seem to hold out for dream candidates with deep backgrounds in machine learning. Many AI-related roles go unfilled for weeks or months—or get taken off job boards only to be reposted soon after.
Playing a different game
It is difficult to define what makes an AI all-star, but I’m sorry to report that it’s probably not whatever you’re doing.
Maybe you’re learning how to work more efficiently with the aid of ChatGPT and its robotic brethren. Perhaps you’re taking one of those innumerable AI certificate courses.
You might as well be playing pickup basketball at your local YMCA in hopes of being signed by the Los Angeles Lakers. The AI minds that companies truly covet are almost as rare as professional athletes.
“We’re talking about hundreds of people in the world, at the most,” says Cristóbal Valenzuela, chief executive of Runway, which makes AI image and video tools.
He describes it like this: Picture an AI model as a machine with 1,000 dials. The goal is to train the machine to detect patterns and predict outcomes. To do this, you have to feed it reams of data and know which dials to adjust—and by how much.
The universe of people with the right touch is confined to those with uncanny intuition, genius-level smarts or the foresight (possibly luck) to go into AI many years ago, before it was all the rage.
As a venture-backed startup with about 120 employees, Runway doesn’t necessarily vie with Silicon Valley giants for the AI job market’s version of LeBron James. But when I spoke with Valenzuela recently, his company was advertising base salaries of up to $440,000 for an engineering manager and $490,000 for a director of machine learning.
A job listing like one of these might attract 2,000 applicants in a week, Valenzuela says, and there is a decent chance he won’t pick any of them. A lot of people who claim to be AI literate merely produce “workslop”—generic, low-quality material. He spends a lot of time reading academic journals and browsing GitHub portfolios, and recruiting people whose work impresses him.
In addition to an uncommon skill set, companies trying to win in the hypercompetitive AI arena are scouting for commitment bordering on fanaticism .
Daniel Park is seeking three new members for his nine-person startup. He says he will wait a year or longer if that’s what it takes to fill roles with advertised base salaries of up to $500,000.
He’s looking for “prodigies” willing to work seven days a week. Much of the team lives together in a six-bedroom house in San Francisco.
If this sounds like a lonely existence, Park’s team members may be able to solve their own problem. His company, Pickle, aims to develop personalised AI companions akin to Tony Stark’s Jarvis in “Iron Man.”
Overlooked
James Strawn wasn’t an AI early adopter, and the father of two teenagers doesn’t want to sacrifice his personal life for a job. He is beginning to wonder whether there is still a place for people like him in the tech sector.
He was laid off over the summer after 25 years at Adobe , where he was a senior software quality-assurance engineer. Strawn, 55, started as a contractor and recalls his hiring as a leap of faith by the company.
He had been an artist and graphic designer. The managers who interviewed him figured he could use that background to help make Illustrator and other Adobe software more user-friendly.
Looking for work now, he doesn’t see the same willingness by companies to take a chance on someone whose résumé isn’t a perfect match to the job description. He’s had one interview since his layoff.
“I always thought my years of experience at a high-profile company would at least be enough to get me interviews where I could explain how I could contribute,” says Strawn, who is taking foundational AI courses. “It’s just not like that.”
The trouble for people starting out in AI—whether recent grads or job switchers like Strawn—is that companies see them as a dime a dozen.
“There’s this AI arms race, and the fact of the matter is entry-level people aren’t going to help you win it,” says Matt Massucci, CEO of the tech recruiting firm Hirewell. “There’s this concept of the 10x engineer—the one engineer who can do the work of 10. That’s what companies are really leaning into and paying for.”
He adds that companies can automate some low-level engineering tasks, which frees up more money to throw at high-end talent.
It’s a dynamic that creates a few handsomely paid haves and a lot more have-nots.

An opulent Ryde home, packed with cinema, pool, sauna and more, is hitting the auction block with a $1 reserve.

When the Writers Festival was called off and the skies refused to clear, one weekend away turned into a rare lesson in slowing down, ice baths included.