Europe’s Stagnating Economy Falls Further Behind the U.S.
Thanks to robust growth and its relative insulation from geopolitical crisis, the U.S. economy has left Europe behind

 4 min
4 min
Europe’s economy stagnated in the final three months of last year, expanding a divide between a booming U.S. economy and a European continent that is increasingly left behind.
The fresh economic data showed higher borrowing costs had compounded the earlier impact of higher energy prices in the wake of Russia’s invasion of Ukraine.
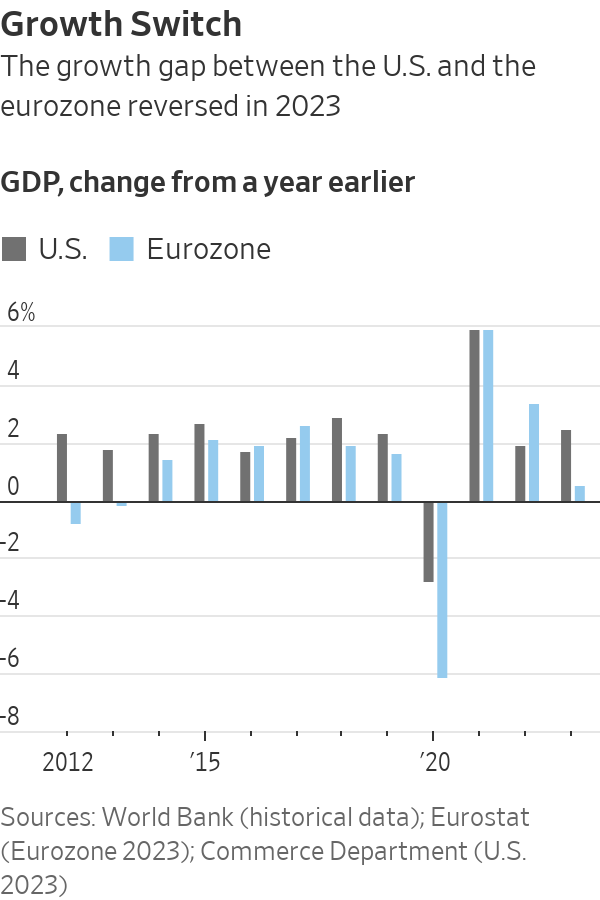
By contrast, the U.S. economy has been expanding robustly and enjoyed its strongest performance relative to the eurozone since 2013—with the exception of the Covid-19 pandemic.
One factor that is threatening to weigh further on the European economy is its proximity to geopolitical flashpoints. Russia’s war on Ukraine sent energy prices rocketing in 2022, hitting European manufacturers. The U.S., as an energy producer, was comparatively unaffected, and its natural-gas industry even benefited when it became Europe’s energy supplier of last resort after Russia throttled gas deliveries to the region.
Now the crisis in the Middle East, which has gummed up cargo traffic through the Red Sea, is adding costs to European importers and disrupting European supply chains. There too, the U.S. hasn’t suffered as much since it has alternative routes for goods coming from Asia.
Europe’s Stoxx 600 index rose 12.64% last year, a little over half the performance of the S&P 500, which rose 24.23% over the same period.
The European Union’s statistics agency Tuesday said gross domestic product in the eurozone was unchanged in the final three months of last year. That followed a decline in the three months through September. During 2023 as a whole, Eurostat recorded growth of just 0.5%, while the U.S. economy expanded by 2.5%.
Still, the divergence between the giant economic blocs is more a story of surprising U.S. strength than unanticipated weakness in the eurozone. The U.S. grew much faster than economists had expected it would at the start of 2023, while the eurozone was about as badly hit by high energy prices and rising interest rates as had been expected. Economists forecast the growth gap will narrow somewhat in the course of the year.
Europe’s policymakers don’t expect the stagnation in output to extend deep into 2024. Instead, they see a pickup in activity as wages rise faster than prices, reversing the declines in real incomes that followed the war in Ukraine and a rise in energy and food bills.
“We have the conditions for recovery that are coming into place,” said European Central Bank President Christine Lagarde Thursday. “I’m not suggesting that it’s going to pick up radically, but it’s coming into place from what we see.”
Helping Europe is the fact that energy prices are falling from post-invasion highs faster than policymakers had expected. That should help boost household spending on other goods and services and lower costs for Europe’s hard-pressed factories.
With inflation easing, the ECB is expected to lower its key interest rate later this year, which would also jolt growth by easing the pressure on household spending and business investment.
Yet the eurozone faces fresh threats too, mainly from the conflict that began with the attack on Israel by Hamas on Oct. 7. Disruptions to shipping in the Red Sea have pushed freight costs sharply higher and led to delays for European manufacturers that rely on Asian suppliers for parts. A further escalation of the conflict could reverse the decline in energy costs and stall the anticipated recovery.
The International Monetary Fund now expects the eurozone to grow by 0.9% this year, a downgrade from its previous 1.2% growth estimate, according to the Fund’s quarterly World Economic Outlook report published on Tuesday. By contrast, it sees the U.S. growing by 2.1% against its earlier 1.5% forecast.
Strong U.S. growth and an estimated 4.6% increase in China’s GDP according to the IMF should more than offset Europe’s disappointing performance and translate into a soft landing for the world economy this year. The IMF now sees the world economy growing at 3.1% this year, the same rate as last year and faster than the 2.9% growth projected in October.
“We find that the global economy continues to display remarkable resilience,” Pierre-Olivier Gourinchas, IMF Chief Economist, told reporters, pointing to the speed at which inflation had receded as a positive surprise.
He warned, however, that geopolitical distortions could reignite price increases. Core inflation—which excludes volatile energy and food prices—isn’t quite back to the pre pandemic trend, particularly for services sector prices, he said.
IMF economists also cautioned that financial markets have been overly optimistic in anticipating early rate cuts by central banks. They project policy interest rates to remain at current levels for the U.S. Federal Reserve, the European Central Bank, and the Bank of England until the second half of 2024, before gradually declining as inflation moves closer to targets. Some investors and analysts expect a Federal Reserve rate cut in the first half of this year.
Back in Europe, Tuesday’s GDP data showed Germany was the weakest of Europe’s large economies at the end of last year, with output falling in the final quarter. However, revised figures showed it avoided a contraction in the three months through September.
“The economy remains stuck in the twilight zone between recession and stagnation,” said Carsten Brzeski, an economist at ING Bank.
While Italy’s economy expanded slightly, the French economy flatlined for the second straight quarter. Ireland, which had been a major source of growth for the eurozone over the previous decade, saw its GDP fall by 1.9% in 2023 as a pandemic-driven boom in its key pharmaceutical industry ended.
In a rare bright spot, Spain finished the year with another strong quarter and matched the U.S. growth rate over 2023 as a whole, thanks to a surge in international tourism as the last of the Covid-19 restrictions were lifted.
 Copyright 2020, Dow Jones & Company, Inc. All Rights Reserved Worldwide. LEARN MORE


Ophora Tallawong has launched its final release of quality apartments priced under $700,000.

From bushland greens to valley reds, the country’s most awarded designers are proving that the best colour palette was never on a swatch card; it was outside the window all along.


The federal budget has rattled property investors. But the biggest mistake isn’t the tax changes, it’s the conclusion many are drawing from them.
2 min
The recent budget has forced a reckoning for property investors.
Negative gearing now restricted to new residential builds, the CGT discount gone and on paper, the numbers look different.
And many investors are responding by pivoting toward yield, prioritising cash flow over capital growth in a way that property strategists say misses the point entirely.
“The debate has shifted to yield versus growth as if they are opposing forces,” says Abdullah Nouh, founder of Melbourne-based buyers’ agency Mecca Property Group. “But that framing is itself the mistake.”
Nouh, who works with high-net-worth families and investors on long-term acquisition strategy, argues that capital growth remains the primary driver of genuine wealth creation and that the post-budget environment has made quality assets more important, not less.
The numbers make his case plainly. An additional $500 per week in rental income is welcome. A prestige asset appreciating by $1 million over a market cycle is transformative.
These are not equivalent outcomes, and portfolios built around yield at the expense of location and land value tend to generate income while wealth stands largely still.
The more nuanced shift Nouh is seeing among sophisticated investors is a move toward assets where both outcomes can be engineered simultaneously – established homes on substantial land in quality locations, where the existing dwelling can be repositioned, rental returns improved, and the underlying land value compounds independent of what sits on it.
For investors with existing equity, commercial property is also entering the conversation in a more serious way.
Prestige industrial assets, medical centres and long-leased essential retail offer income profiles that residential property in most capital city markets cannot currently match: longer lease terms, tenants covering outgoings, and greater predictability than the residential tenancy cycle.
“The investors who build lasting wealth are rarely the ones who chased yield or growth exclusively,” says Nouh.
“They are the ones who built a strategy they could sustain – one that generated enough income to hold quality assets through multiple cycles while those assets compounded in value.”
The budget has changed the settings. It has not changed the fundamentals.

When the Writers Festival was called off and the skies refused to clear, one weekend away turned into a rare lesson in slowing down, ice baths included.

Records keep falling in 2025 as harbourfront, beachfront and blue-chip estates crowd the top of the market.