


What the Stock Market Taught Us This Year: Don’t Fall for These Investing Traps
2023 has been a year in which investors have been more influenced by perception than reality. And that means opportunities in 2024.

 5 min
5 min
The uncertainty around near-term interest rates has dominated the story of the stock market in 2023. Perhaps not since the 1970s—when runaway inflation and sky-high interest rates were the crisis du jour—has monetary policy affected investment outcomes in such a pronounced way.
Yet look more closely, and it would seem that Wall Street has been more influenced by perception than reality: Company and individual balance sheets remain mostly healthy, businesses are battle tested and unemployment remains low. Similarly, the malaise surrounding the economic environment belies what we are seeing. Cruise ships are sold out, restaurants are packed, holiday shopping was off to a strong start and 82% of S&P 500 companies reported a positive earnings surprise in the third quarter.
Still, a nervous atmosphere has undercut stock performance. Scores of share prices have been lacklustre as company fundamentals have been eclipsed by macroeconomic conjecture. We have lost the trees in the forest.
But as someone once declared, “It is a market of stocks, not a stock market.” This is a wise reminder that no matter the conditions, there are investment opportunities to be had. In fact, the more economic obfuscation, the more sectors are hammered, the more stocks are orphaned, the better the odds of long-term investment success.
After a year of hand-wringing through monetary policy guesswork and market fluctuations, many wonder how best to maneuvre in the new year. Here’s our advice: Avoiding some of the biggest market traps can be a winning strategy.
Don’t Fed-watch
“Don’t fight the Fed” is a well-known market mantra. The idea is to buy stocks when the Fed is lowering interest rates and sell when the Fed is raising them.
This psychology has dominated the stock market all year, creating a futile guessing game. Are they still raising rates? For how much longer? Will rates fall soon? Will it be a hard landing or a soft landing? But this Fed obsession, reacting to every pronouncement, simply sucks up time. It has all been noise. Despite the fear and uncertainty, dire predictions didn’t come true.
What that means is that sectors that sold off because of heightened fears—including banks, some industrial names and anything real estate related—could be well-positioned for investors willing to take a longer-term view.
After surviving a midyear crisis, for instance, the banking sector is already beginning to show signs of recovery as market anxiety subsides. Similarly, oversold housing-related stocks should rebound once people adjust to the new rate environment, and the U.S. housing shortage, exacerbated by the pandemic, drives new construction.
It doesn’t mean every sector that got hit by investor angst is ripe for buying. Commercial real estate is an obvious example. But it does mean that if you invested by watching the Fed like a tennis match, and then reacting to every volley, you will get it wrong.
Don’t buy the hype
The selloff in many areas has inflicted pain that has been concealed by the cap-weighted dominance of a few celebrity stocks in the S&P 500 index. A handful of tech and tech-related stocks, weight-loss drugs and artificial-intelligence providers offer the sum total of stock-market outperformance this year. Beyond these headliners, there is less and less attention on individual names.
Those tech behemoths, dubbed the “Magnificent Seven,” account for more than 30% of the index and 87% of its return through October. Let us say that again: Just seven stocks represent one-third of the S&P 500 index. Some now consider Google parent Alphabet, Amazon.com, Apple, Facebook parent Meta Platforms, Microsoft, Nvidia and Tesla to be defensive businesses that can grow through any economic cycle.
We’ve seen this before, and the lesson is always the same: Winner-takes-all can dominate over shorter time frames but is rarely a winning bet in the long run. At some point, this narrow market supremacy will end, to the benefit of many overlooked issues.
In other words, these hyped celebrity stocks have more downside than upside from here. There are more-compelling opportunities to be had.
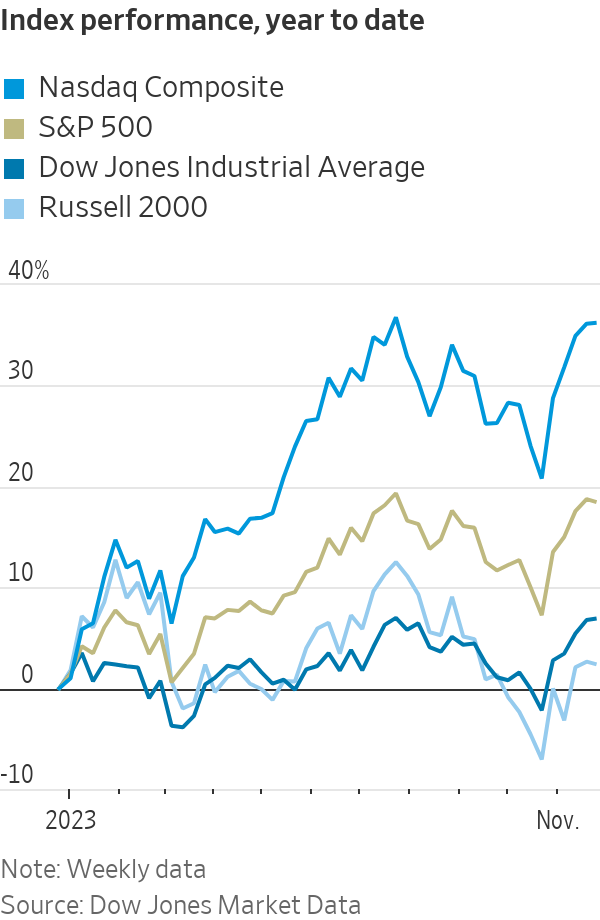
For example, the small-fry stocks found in the Russell 2000 index are among the most neglected shares waiting to get their due. The index has been languishing in a bear market since 2021—partially driven by their perceived economic sensitivity and partially driven by Wall Street indifference.
The result is that the total market cap of the Magnificent Seven is now three times the size of every single stock in the Russell 2000 index combined—making just seven stocks the equivalent of 6,000 small-cap names. On average, 47 analysts follow the typical Magnificent Seven stock versus just five for a small-cap name. Nine percent of smaller companies have no followers at all.
Here’s the silver lining: Less coverage means more market inefficiency means more opportunities. Stock prices trade on fundamentals. And when those solid fundamentals shine through, share prices rise. Additionally, when tepid U.S. growth inevitably picks up, small-caps are poised to strongly outperform as they have done every other time in the past.
The upshot is that you can go ahead and buy the hype if you want to, blinded by the celebrity names. But that’s not where the upside opportunities are likely to be.
Don’t anchor to the here and now
This time is different. Except it hardly ever is.
That’s a lesson investors rarely learn. Case in point: the extremely low interest rates that have persisted for much of the past two decades. Over the past 50 years, U.S. interest rates have averaged 5.98%. Today’s 5.5% rate seems high compared with the 0.25% paid during the recession of 2008, but no comparison to 1980 when rates topped out at 20%.
Similarly, at the start of the new millennium, a 30-year fixed-rate mortgage was 8.08%—basically in line with 2023 levels, but significantly higher than the bargain 2.96% rate that could be had just two years ago.
Higher interest rates now feel like a shock to our systems because we got anchored to some extreme lows. When considered in the full context of a longer history, though, they are in line.
Now people are anchored to the S&P 500 beating everything else. But just as we have seen with interest rates in 2023, the trend will revert to the mean, even if it takes a while.
Don’t fear volatility
Although it may feel uncomfortable, it is often easier to invest at the extremes—when valuations are crushed, buy signals are blaring and the bad news is priced in. Such conditions have the greatest profit potential, but the inherent volatility makes investors nervous.
This angst is playing out in the price action surrounding earnings announcements. FactSet reports that stocks are getting hit harder for negative earnings surprises. In turn, this drives up their volatility. In the third quarter, an earnings miss cost the typical company 5.2% in market value—more than twice the 2.3% average over the past five years.
Instead of running for the exits, we view volatility as our friend and actively seek to take advantage of the price movements. Everyone says they want to buy low, but when the opportunity arises, many wait for the dust to settle and miss the moneymaking moment.
Don’t bet against America
The market has turned more optimistic as the year winds down and we see plenty of value-beneath-the-surface stocks.
But even if investors have found some trees, they still have some concerns about the forest. Two terrible wars, congressional dysfunction, a border emergency and mounting unrest lurk over our economy as well as those around the globe.
In these unnerving moments, we are comforted by the faith in the resiliency of our capitalist democracy from capitalism’s own Yoda, Warren Buffett. He wrote in the 2012 Berkshire Hathaway shareholder letter, “Of course, the immediate future is unknown; America has faced the unknown since 1776…. Periodic setbacks will occur, yes, but investors and managers are in a game that is heavily stacked in their favour.”
Indeed, our markets have overcome a Great Depression, multiple recessions, global and regional conflicts, a modern-day pandemic and all other kinds of unforeseeable blows. Through it all, America has endured, and we have every reason to believe she will continue to do so.
Mellody Hobson is co-CEO and president, and John W. Rogers Jr. is founder, co-CEO and chief investment officer, of Ariel Investments.
 Copyright 2020, Dow Jones & Company, Inc. All Rights Reserved Worldwide. LEARN MORE


Ophora Tallawong has launched its final release of quality apartments priced under $700,000.

From bushland greens to valley reds, the country’s most awarded designers are proving that the best colour palette was never on a swatch card; it was outside the window all along.


The federal budget has rattled property investors. But the biggest mistake isn’t the tax changes, it’s the conclusion many are drawing from them.
2 min
The recent budget has forced a reckoning for property investors.
Negative gearing now restricted to new residential builds, the CGT discount gone and on paper, the numbers look different.
And many investors are responding by pivoting toward yield, prioritising cash flow over capital growth in a way that property strategists say misses the point entirely.
“The debate has shifted to yield versus growth as if they are opposing forces,” says Abdullah Nouh, founder of Melbourne-based buyers’ agency Mecca Property Group. “But that framing is itself the mistake.”
Nouh, who works with high-net-worth families and investors on long-term acquisition strategy, argues that capital growth remains the primary driver of genuine wealth creation and that the post-budget environment has made quality assets more important, not less.
The numbers make his case plainly. An additional $500 per week in rental income is welcome. A prestige asset appreciating by $1 million over a market cycle is transformative.
These are not equivalent outcomes, and portfolios built around yield at the expense of location and land value tend to generate income while wealth stands largely still.
The more nuanced shift Nouh is seeing among sophisticated investors is a move toward assets where both outcomes can be engineered simultaneously – established homes on substantial land in quality locations, where the existing dwelling can be repositioned, rental returns improved, and the underlying land value compounds independent of what sits on it.
For investors with existing equity, commercial property is also entering the conversation in a more serious way.
Prestige industrial assets, medical centres and long-leased essential retail offer income profiles that residential property in most capital city markets cannot currently match: longer lease terms, tenants covering outgoings, and greater predictability than the residential tenancy cycle.
“The investors who build lasting wealth are rarely the ones who chased yield or growth exclusively,” says Nouh.
“They are the ones who built a strategy they could sustain – one that generated enough income to hold quality assets through multiple cycles while those assets compounded in value.”
The budget has changed the settings. It has not changed the fundamentals.

New research suggests that bonuses make employees feel more like a mere cog in a wheel.

Odd Culture Group brings a new kind of after-dark energy to the CBD, where daiquiris, disco and design collide beneath the city streets.


