Population of the World’s Ultra-Rich Grew 7.6% Last Year, With Continued Concentration at the Top

 2 min
2 min
The ultra-wealthy rebounded in size and influence last year.
The global population of the ultra-rich rose by 7.6% to 426,300 individuals last year, with a correlating 7.1% jump in net worth to US$49.2 trillion, according to Altrata’s annual report on those with at least US$30 million in investable assets.
The majority of this group (80%) have a net worth between US$30 million and US$100 million, while those worth US$100 million to US$1 billion make up most of the remaining 20%. Billionaires represent only a sliver of the ultra-rich population (0.8%), but hold 24% of all wealth.
The largest percentage of wealthy individuals in the world live in North America. Their numbers continued to rise last year, increasing by 11.9% to 161,280. This increases the region’s global share of ultra rich to 37.8%. The collective net worth of this group rose by a similar percentage, to US$18.6 trillion.
The U.S. continues to far outpace any other nation in terms of wealth. The country saw a 13% rise in its ultra-wealthy population making it home to a little more than one-third of the global ultra-wealthy population, according to the report.
Meanwhile, the pace of wealth growth in Asia appears to be shifting. Hong Kong was the only Chinese city to make the top 10 of the world’s wealthiest locales amid a “structural slowing” of China’s economy and the mainland’s tightening grip on the city. Hong Kong which saw no material change in its wealth status, ranked second behind New York in terms of number of wealthy individuals.
In contrast, the report said that three of the fastest-growing cities among the top 10 for the ultra wealthy in the next five years will be in India. Bengaluru, Hyderabad, and Delhi are expected to grow at an annual average rate of 14% to 16%.
In other regions, the populations of the ultra-rich declined by almost 6% in the Middle East and by nearly double digits in Africa. But more individuals reached the upper wealth tiers in Europe, where the ultra-rich gained 9.4% more members, and in Central and South America, which gained 18.2% more.
The world’s wealthiest also account for a significant amount of global spending and giving. The report said the group spent US$118 billion on personal luxury goods last year, equivalent to 30% of all spending in the category. They also accounted for US$190 billion of philanthropic donations, equal to 38% of all giving.
Looking ahead, the report predicts that this ultra-wealthy population will grow to more than 587,000 individuals by 2028 (an increase of more than 160,000 from 2023 figures), adding US$19 trillion of newly created wealth.
 Copyright 2020, Dow Jones & Company, Inc. All Rights Reserved Worldwide. LEARN MORE




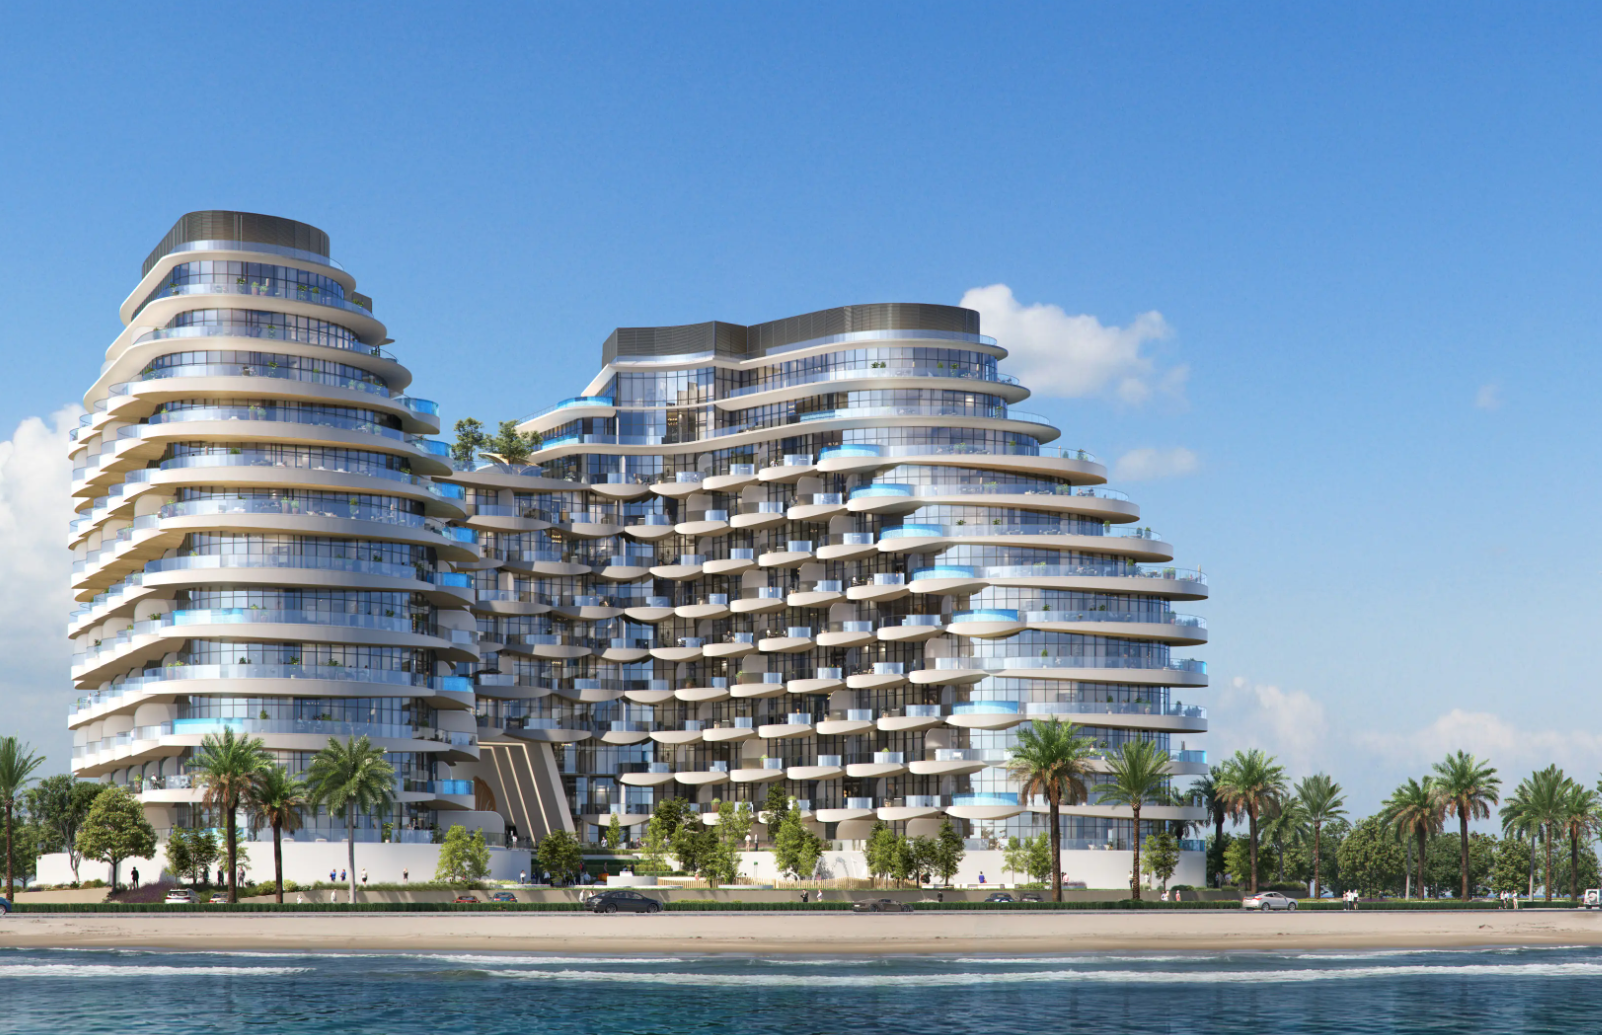
BNW Developments has established a Sydney presence, joining Arada and Sobha Realty among the growing number of UAE developers pursuing Australian buyers and development opportunities.

Australian shares fell on Thursday as Wall Street weakness, rising oil and persistent rate concerns weighed on most of the market. The S&P/ASX 200 declined 0.72 per cent to 8,702. The All Ordinaries lost 0.66 per cent to finish at 8,897. Mining stocks were hit particularly hard, while real estate also dragged on the index. …
Continue reading “ASX falls 0.7 per cent as miners and property stocks retreat”

 2 min
2 minAustralian shares fell on Thursday as Wall Street weakness, rising oil and persistent rate concerns weighed on most of the market.
The S&P/ASX 200 declined 0.72 per cent to 8,702. The All Ordinaries lost 0.66 per cent to finish at 8,897. Mining stocks were hit particularly hard, while real estate also dragged on the index.
Energy was the notable exception, gaining more than one per cent as Brent crude traded above US$103 a barrel. Oil had moved higher amid uncertainty surrounding potential US diesel-export restrictions and broader geopolitical supply risks. The move supported energy producers but renewed concern about inflation inputs across transport and the wider economy.
Gold shares were weak even as spot bullion remained historically elevated. The All Ordinaries Gold index fell about 2.25 per cent, showing that equity performance can diverge from the commodity because of valuation, currency, operating and company-specific factors.
Zip was a prominent loser, falling 11.38 per cent after the company reported short sales after the previous close. Nine Entertainment also weakened after UBS analysts warned of near-term revenue challenges associated with its advertising-supported subscription tier.
Premier Investments led larger winners despite caution about the retail environment. Breville, in which Premier owns a significant stake, also appeared among leading movers. In the broader ASX 300 screen, Myer gained 11.43 per cent and MAAS Group rose 7.93 per cent, while Lotus Resources fell 10.53 per cent. These percentage moves should be checked against company announcements and trading liquidity before attributing causes.
The Australian dollar was broadly flat at US70.38 cents. Spot gold was around US$4,280 an ounce, Brent crude approximately US$103.08 a barrel and iron ore near US$96.90 a tonne late in the session.
The rate outlook remains the central domestic catalyst. Labour-market weakness has not eliminated the possibility of an RBA increase next week, leaving banks, listed property and other rate-sensitive sectors exposed to changing expectations.
Market dashboard
S&P/ASX 200: 8,702, down 0.72 per cent.
All Ordinaries: 8,897, down 0.66 per cent.
Best sector: Energy, up more than one per cent.
Weakest areas: Real estate and materials were the major drags; confirm final sector percentages before publication.
Material winner: Premier Investments led the large-company gainers. Confirm its final closing move from the ASX before publication.
Material loser: Zip, down 11.38 per cent.
ASX 300 percentage leader: Myer, up 11.43 per cent.
ASX 300 percentage laggard: Zip, down 11.38 per cent.
AUD/USD: Approximately US$0.7038, broadly flat.

A survey of people with at least $1 million in investable assets found women in their 30s and 40s look nothing like older generations in terms of assets and priorities

From farm-to-table Thai to fairy-lit mango trees and Coral Sea vistas, Port Douglas has award-winning dining and plenty of tropical charm on the side.