


The Primary Breadwinner Is Disappearing From More Homes
The economics of marriage are changing, but women still take on more of the unpaid labour

 4 min
4 min
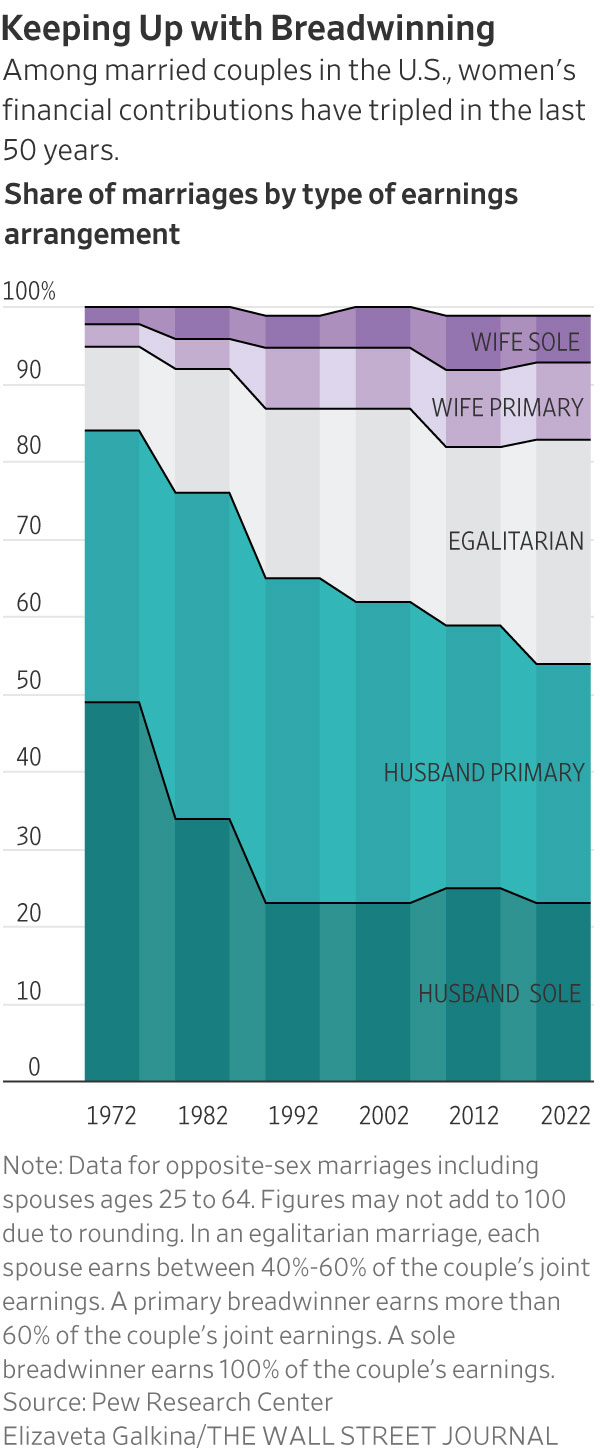
Nearly a third of marriages today have no primary breadwinner, as women continue to make strides toward greater equality at work and home.
About 30% of U.S. opposite-sex marriages are egalitarian in earnings, according to new data from Pew Research Center, meaning each spouse earns somewhere between 40% and 60% of the couples’ joint earnings. One of the main drivers of the shift is younger women making more money, said Pew.
The share of women earning more than their husbands has more than tripled from 5% to 16% over the last 50 years. In 1972, 49% of husbands were the sole breadwinner, meaning the husband had positive earnings and the wife had no earnings. By 2022, that share had dropped to 23% of opposite-sex marriages.
But the larger financial contributions by women don’t mean that relationships are more equal or women are better off in every realm of life, said Richard Fry, senior researcher at Pew Research Center.
Even when women earn as much as their husbands, they still put in around two more hours a week on caregiving than their husbands do, plus another 2.5 hours more on housework, according to Pew. In those same relationships, men spend nearly 3.5 more hours on leisure activities, such as watching television or playing video games, than their wives do.
Women’s economic role in marriages continues to rise despite a persistent gender pay gap and declining labor-force participation, Mr. Fry said. “In spite of some trends that would suggest to me that women’s economic role would not be growing, what we found was ‘No, it still is,’” he said.
Financial advisers and researchers say the changing money dynamic can cause marital strife, or in some cases, divorce.
Changes in breadwinner status “can lead to a lot of frustrations and arguments and resentment,” said Stacy Francis, president and chief executive of wealth-management firm Francis Financial and founder of a financial-education nonprofit.
When Ms. Francis, who often works with breadwinning women, surpassed her husband in earnings, she said the pair celebrated. After years of bearing the burden of bringing home most of the bacon, her husband was somewhat relieved to turn the job over to her, she said.
But Ms. Francis, now 48, soon found herself spending more time in the kitchen, throwing herself into the local parent-teacher association and planning her son’s prom—all, she said, in an effort to somehow compensate for other work and time spent away.
“It made me feel less feminine to earn more than my husband,” she said. “I realised, looking back, that I myself had to get comfortable with that role.”
Men remain the breadwinner in most marriages, meaning they earn more than 60% of the total earnings, Pew found.
The marriages with the highest total income are those in which both spouses are bringing in money. Marriages in which women are the primary breadwinners earn more than those in which men hold the same role: $145,000 in median income compared with $121,000 for marriages overall, according to the Pew data. A primary breadwinner in Pew’s research occurs when one spouse earns more than 60% of the household earnings.
Sole-breadwinner couples, or marriages in which one spouse has earnings and the other has none, make significantly less, with median incomes of around $75,000. Such couples also are more likely to be below the poverty line.
When women are the sole breadwinners, men spend more time on caregiving and a more equal amount of housework, compared with egalitarian marriages. But women still spend roughly the same amount of time on caregiving and household work, regardless of whether they are in egalitarian marriages or are sole or primary breadwinners, Pew found. Women without children are more likely to be the primary breadwinner than those with children.
Spouses within same-sex couples, however, tend to split the domestic labor more equally than their heterosexual counterparts, research shows.
Some researchers say one reason for the housework divide is that most of these gender roles have been built up over generations. There is a fear from some women that stopping this work could risk their marriage.
“We still see that there are remnants and large cultural issues associated with the sensitivity of women’s economic success, as a thing that destroys relationships,” said Johanna Rickne, professor of economics at the Swedish Institute for Social Research at Stockholm University.
Both husbands and wives can work to address these imbalances, said Jennifer Clark, a 34-year-old digital marketer based outside Chicago.
While her husband, a director of an audio-production company, has earned more than Ms. Clark for much of their 10-year marriage, she sets the monthly budget and manages household finances.
“It doesn’t feel like he has a larger share of the finances even though he is earning that money,” she said.
Throughout their marriage, Ms. Clark worked in freelance and part-time roles while her husband had full-time jobs. During those periods, she said, she bore a greater share of the household and caregiving responsibilities for their two children. But talking about their finances and making decisions together helped them remain equal partners.
“I would say I’ve always had a pretty good sense of financial autonomy, even with money I didn’t necessarily earn, because we make those decisions collaboratively,” she said.
 Copyright 2020, Dow Jones & Company, Inc. All Rights Reserved Worldwide. LEARN MORE


A record-breaking $11 million sale at The Centennial Collection has set a new benchmark for luxury apartment living in Bondi Junction.

As interest rates, inflation and market sentiment fluctuate, investors are being urged to focus on data, not panic.


The federal budget has rattled property investors. But the biggest mistake isn’t the tax changes, it’s the conclusion many are drawing from them.
2 min
The recent budget has forced a reckoning for property investors.
Negative gearing now restricted to new residential builds, the CGT discount gone and on paper, the numbers look different.
And many investors are responding by pivoting toward yield, prioritising cash flow over capital growth in a way that property strategists say misses the point entirely.
“The debate has shifted to yield versus growth as if they are opposing forces,” says Abdullah Nouh, founder of Melbourne-based buyers’ agency Mecca Property Group. “But that framing is itself the mistake.”
Nouh, who works with high-net-worth families and investors on long-term acquisition strategy, argues that capital growth remains the primary driver of genuine wealth creation and that the post-budget environment has made quality assets more important, not less.
The numbers make his case plainly. An additional $500 per week in rental income is welcome. A prestige asset appreciating by $1 million over a market cycle is transformative.
These are not equivalent outcomes, and portfolios built around yield at the expense of location and land value tend to generate income while wealth stands largely still.
The more nuanced shift Nouh is seeing among sophisticated investors is a move toward assets where both outcomes can be engineered simultaneously – established homes on substantial land in quality locations, where the existing dwelling can be repositioned, rental returns improved, and the underlying land value compounds independent of what sits on it.
For investors with existing equity, commercial property is also entering the conversation in a more serious way.
Prestige industrial assets, medical centres and long-leased essential retail offer income profiles that residential property in most capital city markets cannot currently match: longer lease terms, tenants covering outgoings, and greater predictability than the residential tenancy cycle.
“The investors who build lasting wealth are rarely the ones who chased yield or growth exclusively,” says Nouh.
“They are the ones who built a strategy they could sustain – one that generated enough income to hold quality assets through multiple cycles while those assets compounded in value.”
The budget has changed the settings. It has not changed the fundamentals.

Warmer minimalism, tactile materials and wellness focused layouts are redefining luxury interiors as homeowners design for comfort, connection and lasting appeal.

Ophora Tallawong has launched its final release of quality apartments priced under $700,000.


