Airlines Need to Boost Revenue. They’re Coming for Your Bags.

 2 min
2 min
Airlines facing tough financial comparisons after a bumper year have a plan to boost revenue that fliers will hate. They’re raising the price of checking your bag.
Delta Air Lines , the latest company to announce a price hike, announced last week it was increasing the cost of a passenger’s first checked bag to $35 from $30 and a second bag to $45 from $40. The company last increased checked baggage fees in 2018. American Airlines and United Airlines made similar changes, raising baggage fees by about $5, and JetBlue Airways and Alaska Airlines have also raised prices.
Airline companies are dealing with a double whammy. Higher labour costs and an uptick in maintenance costs are eating into revenue. Meanwhile, domestic demand has softened , hitting pricing power for airlines.
Fees are a significant and growing source of revenue for airlines. U.S. airlines generated $6.8 billion from bag fees in 2022, according to the Bureau of Transportation Statistics , up from $5.3 billion in 2021. American Airlines generated $1.4 billion from baggage fees that year, which accounts for less than 3% of its 2022 revenue. United made $1.1 billion, or 2.6% of its 2022 revenue; Delta pocketed $980 million, or 2.1% of its 2022 revenue.
It’s likely those figures grew in 2023, a record-breaking year for travel with six of the 10 busiest days in U.S. aviation history, according to the Transportation Security Administration. With airlines hiking prices on the first checked bag by an average of 17%, that number could rise again this year.
That should help offset the decline in airfare. Ticket prices were 6% lower in January compared with the year-ago period, according to January’s consumer price index data. Online travel agency Hopper expects domestic fares to remain below 2023 and pre pandemic levels for at least the first half of the year.
Hopper’s lead economist Hayley Berg said more planes in the air have helped bring prices down. “Price relief on domestic airfare comes as domestic seat capacity has maintained at least a 5% lift over 2019 levels throughout 2023,” she said.
Ultimately, baggage fees account for between 2% and 3% of revenue for the largest U.S. airlines. But the market will be judging United, American, and Delta against a strong 2023, so every little helps. All three stocks have risen between 7% and 10% in 2024. And there are other more important factors, such as costs, demand, and capacity constraints, that will have a larger impact on earnings.
Of course, earnings aren’t the first thing on the minds of travellers who are now getting hit with higher fees.
 Copyright 2020, Dow Jones & Company, Inc. All Rights Reserved Worldwide. LEARN MORE


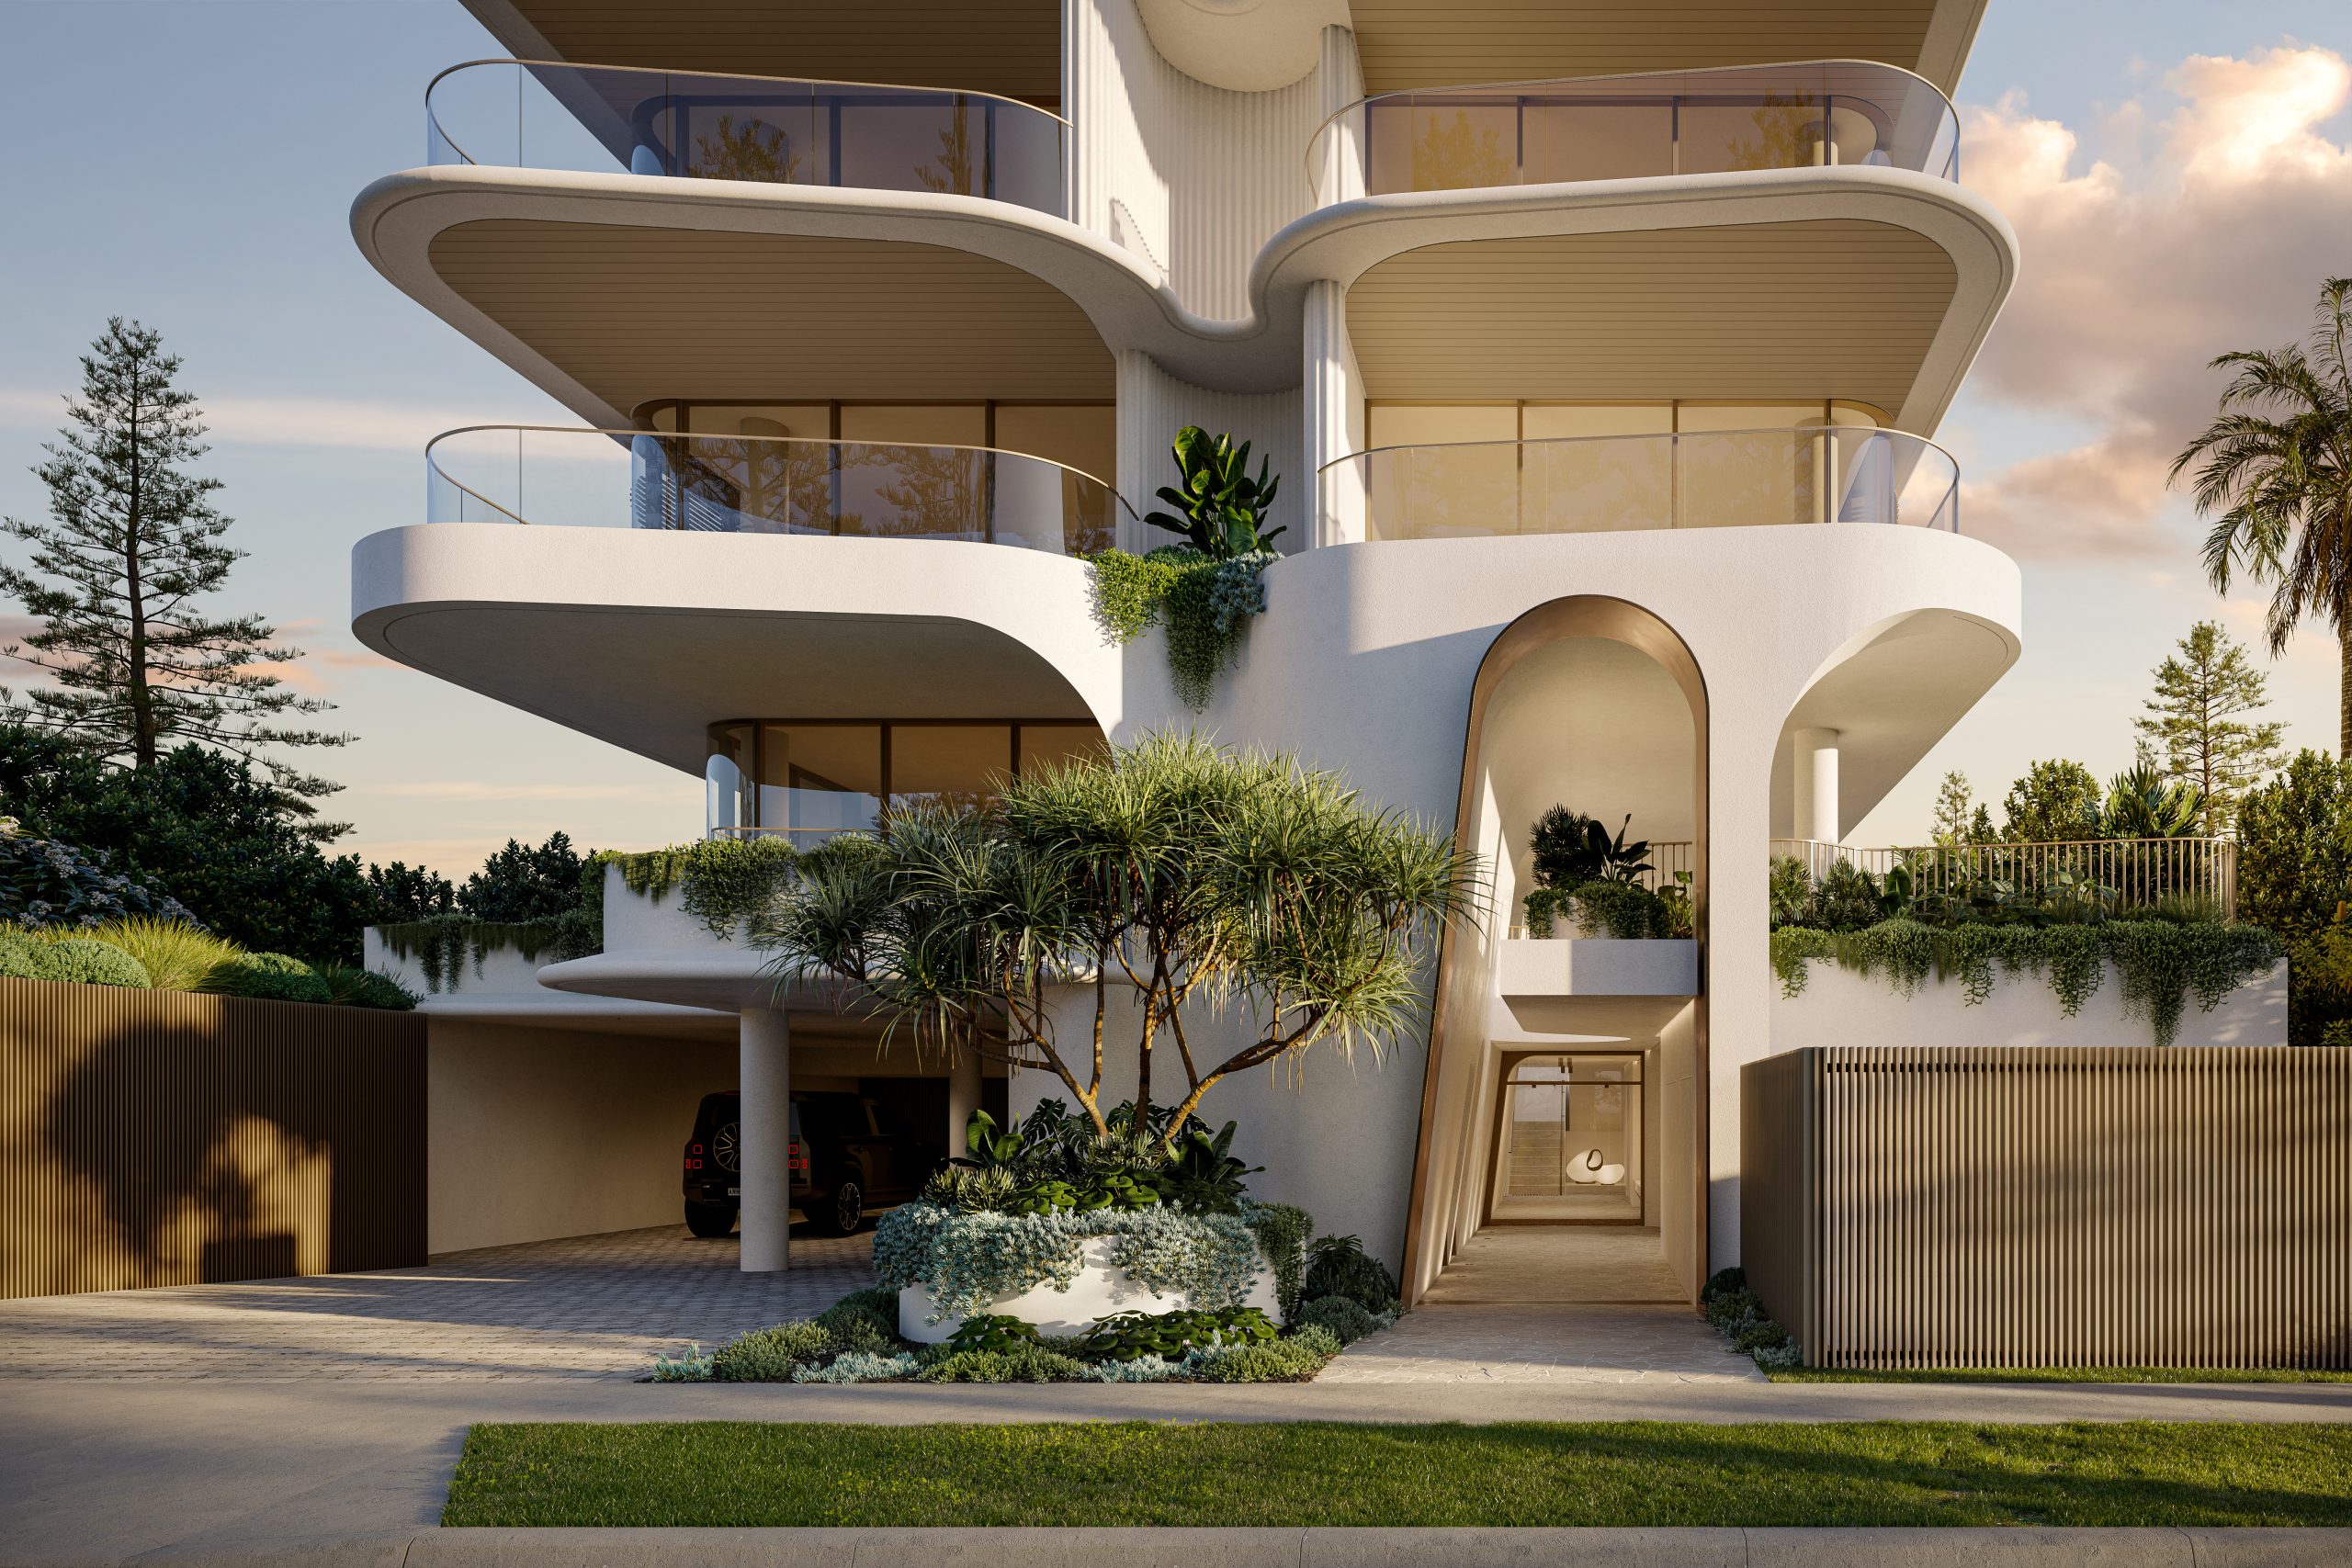
Ophora Tallawong has launched its final release of quality apartments priced under $700,000.

From bushland greens to valley reds, the country’s most awarded designers are proving that the best colour palette was never on a swatch card; it was outside the window all along.

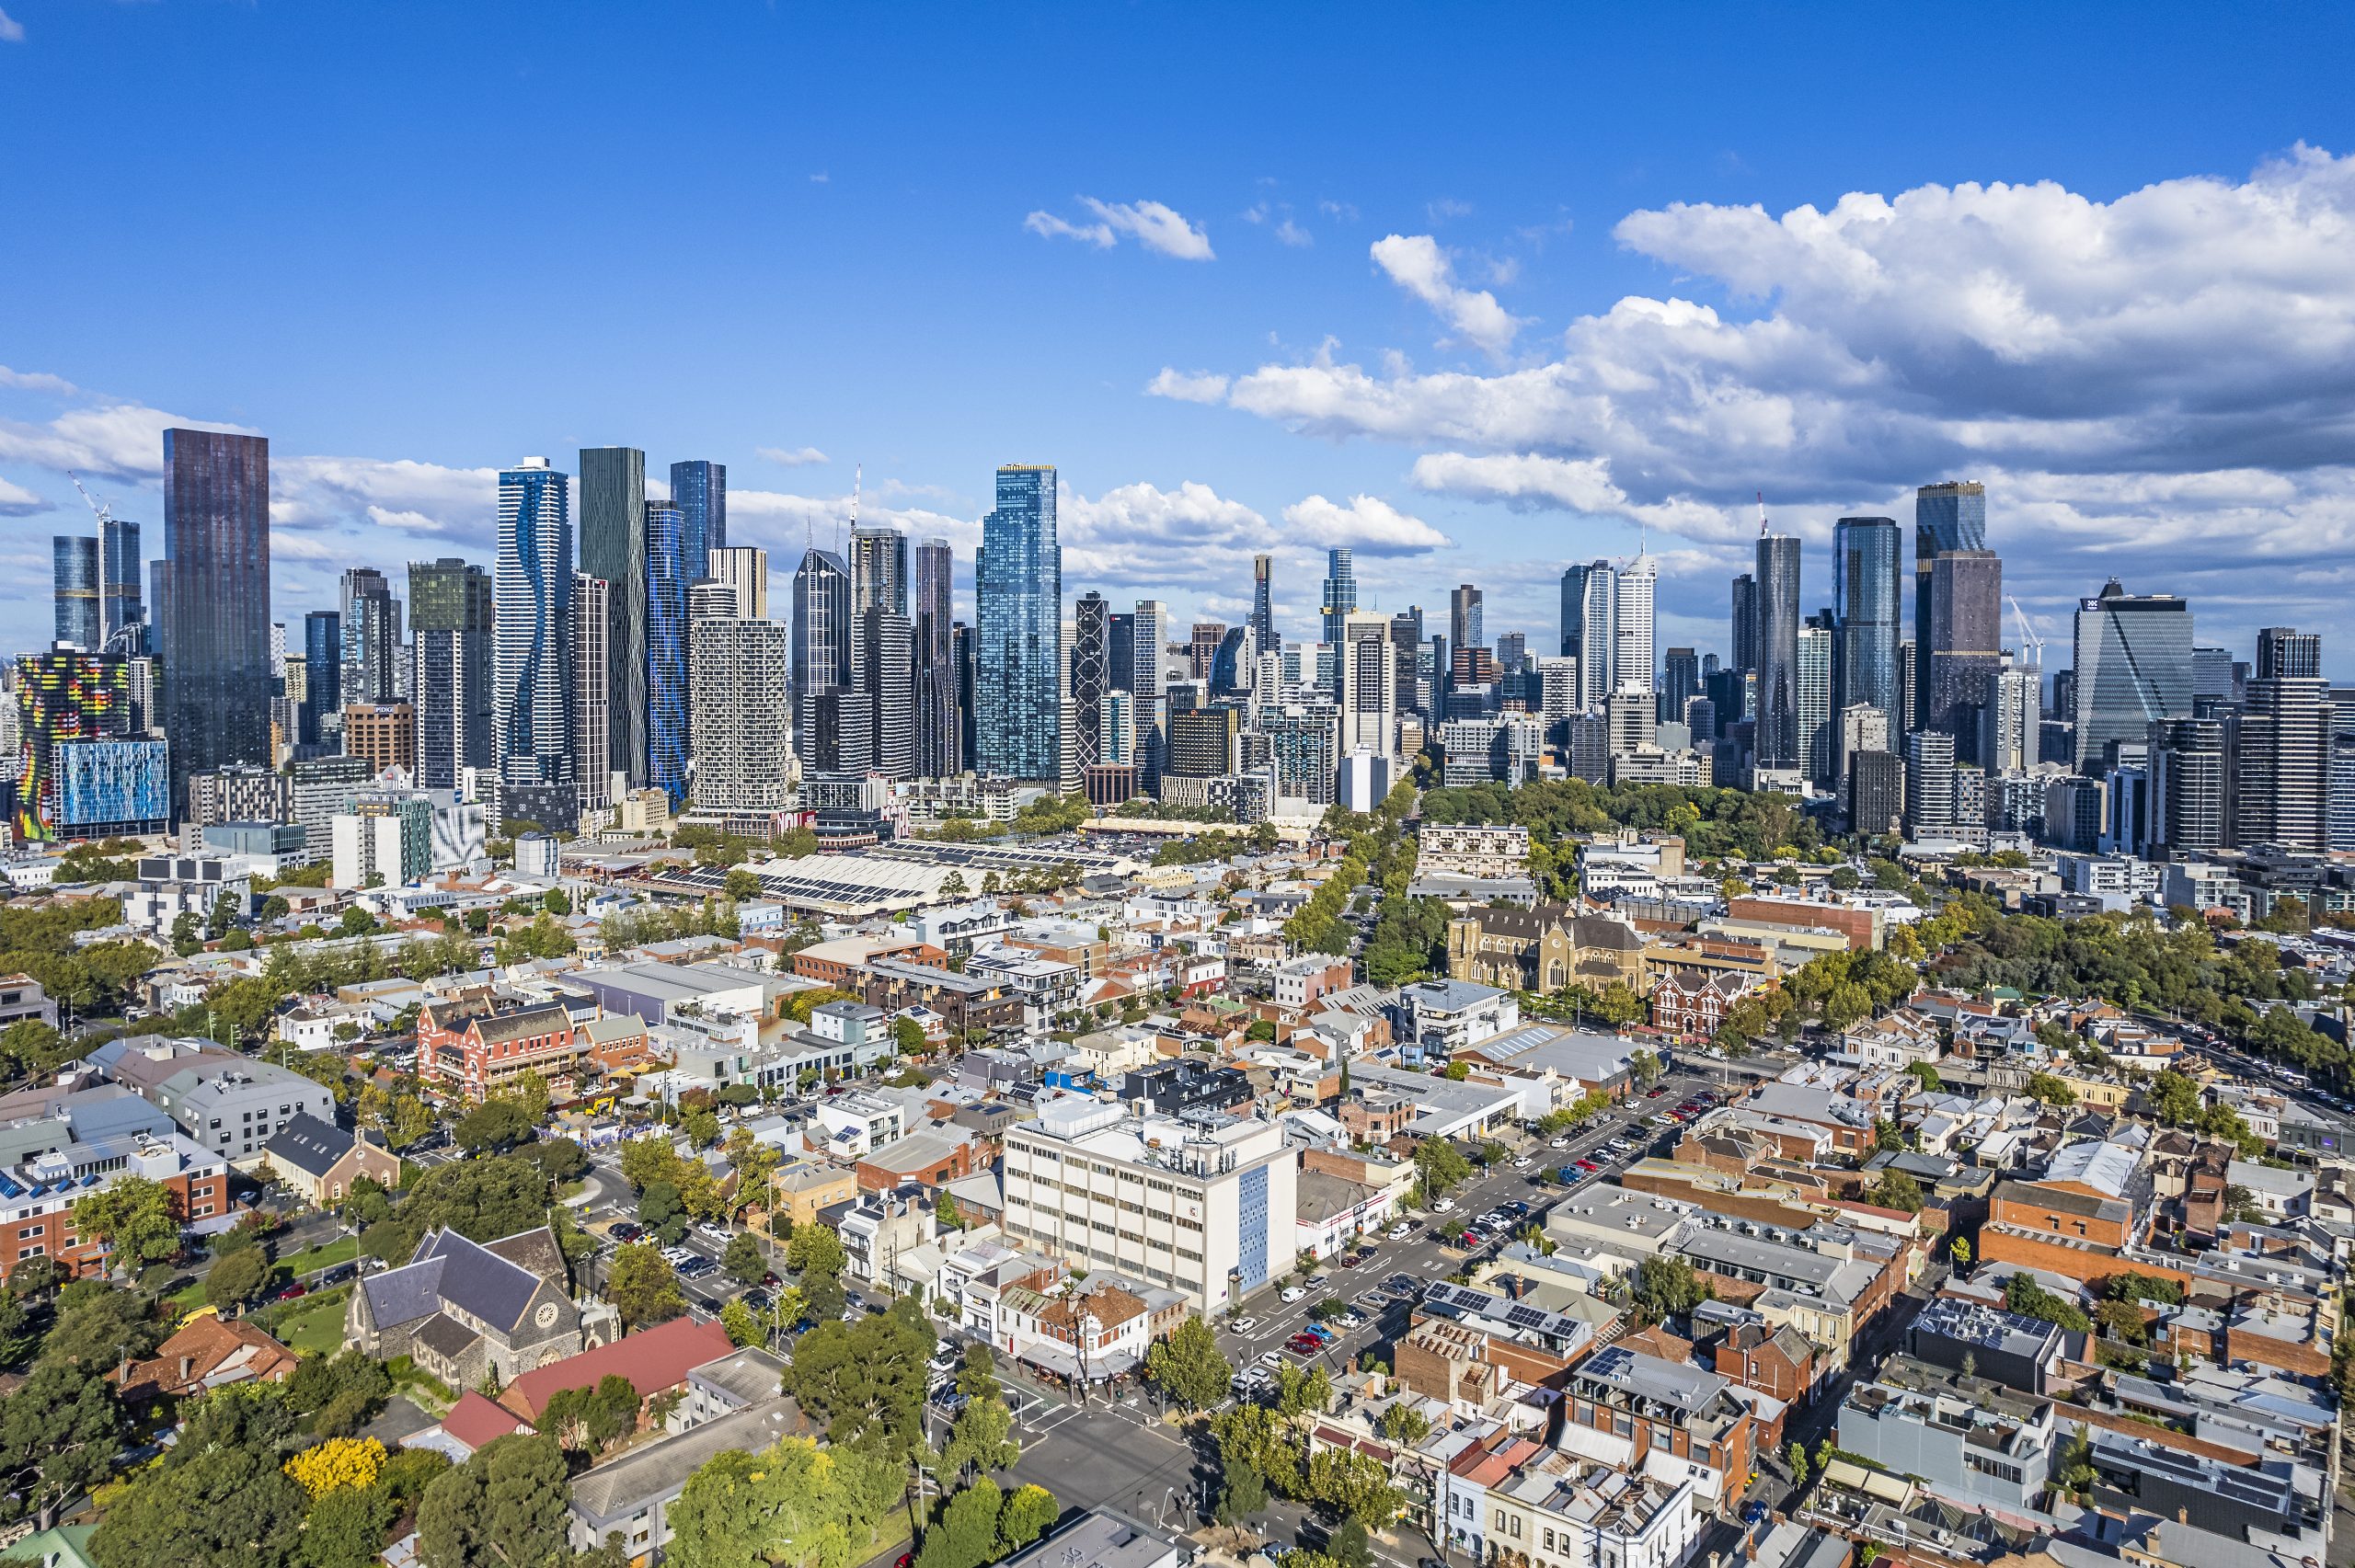
The federal budget has rattled property investors. But the biggest mistake isn’t the tax changes, it’s the conclusion many are drawing from them.
2 min
The recent budget has forced a reckoning for property investors.
Negative gearing now restricted to new residential builds, the CGT discount gone and on paper, the numbers look different.
And many investors are responding by pivoting toward yield, prioritising cash flow over capital growth in a way that property strategists say misses the point entirely.
“The debate has shifted to yield versus growth as if they are opposing forces,” says Abdullah Nouh, founder of Melbourne-based buyers’ agency Mecca Property Group. “But that framing is itself the mistake.”
Nouh, who works with high-net-worth families and investors on long-term acquisition strategy, argues that capital growth remains the primary driver of genuine wealth creation and that the post-budget environment has made quality assets more important, not less.
The numbers make his case plainly. An additional $500 per week in rental income is welcome. A prestige asset appreciating by $1 million over a market cycle is transformative.
These are not equivalent outcomes, and portfolios built around yield at the expense of location and land value tend to generate income while wealth stands largely still.
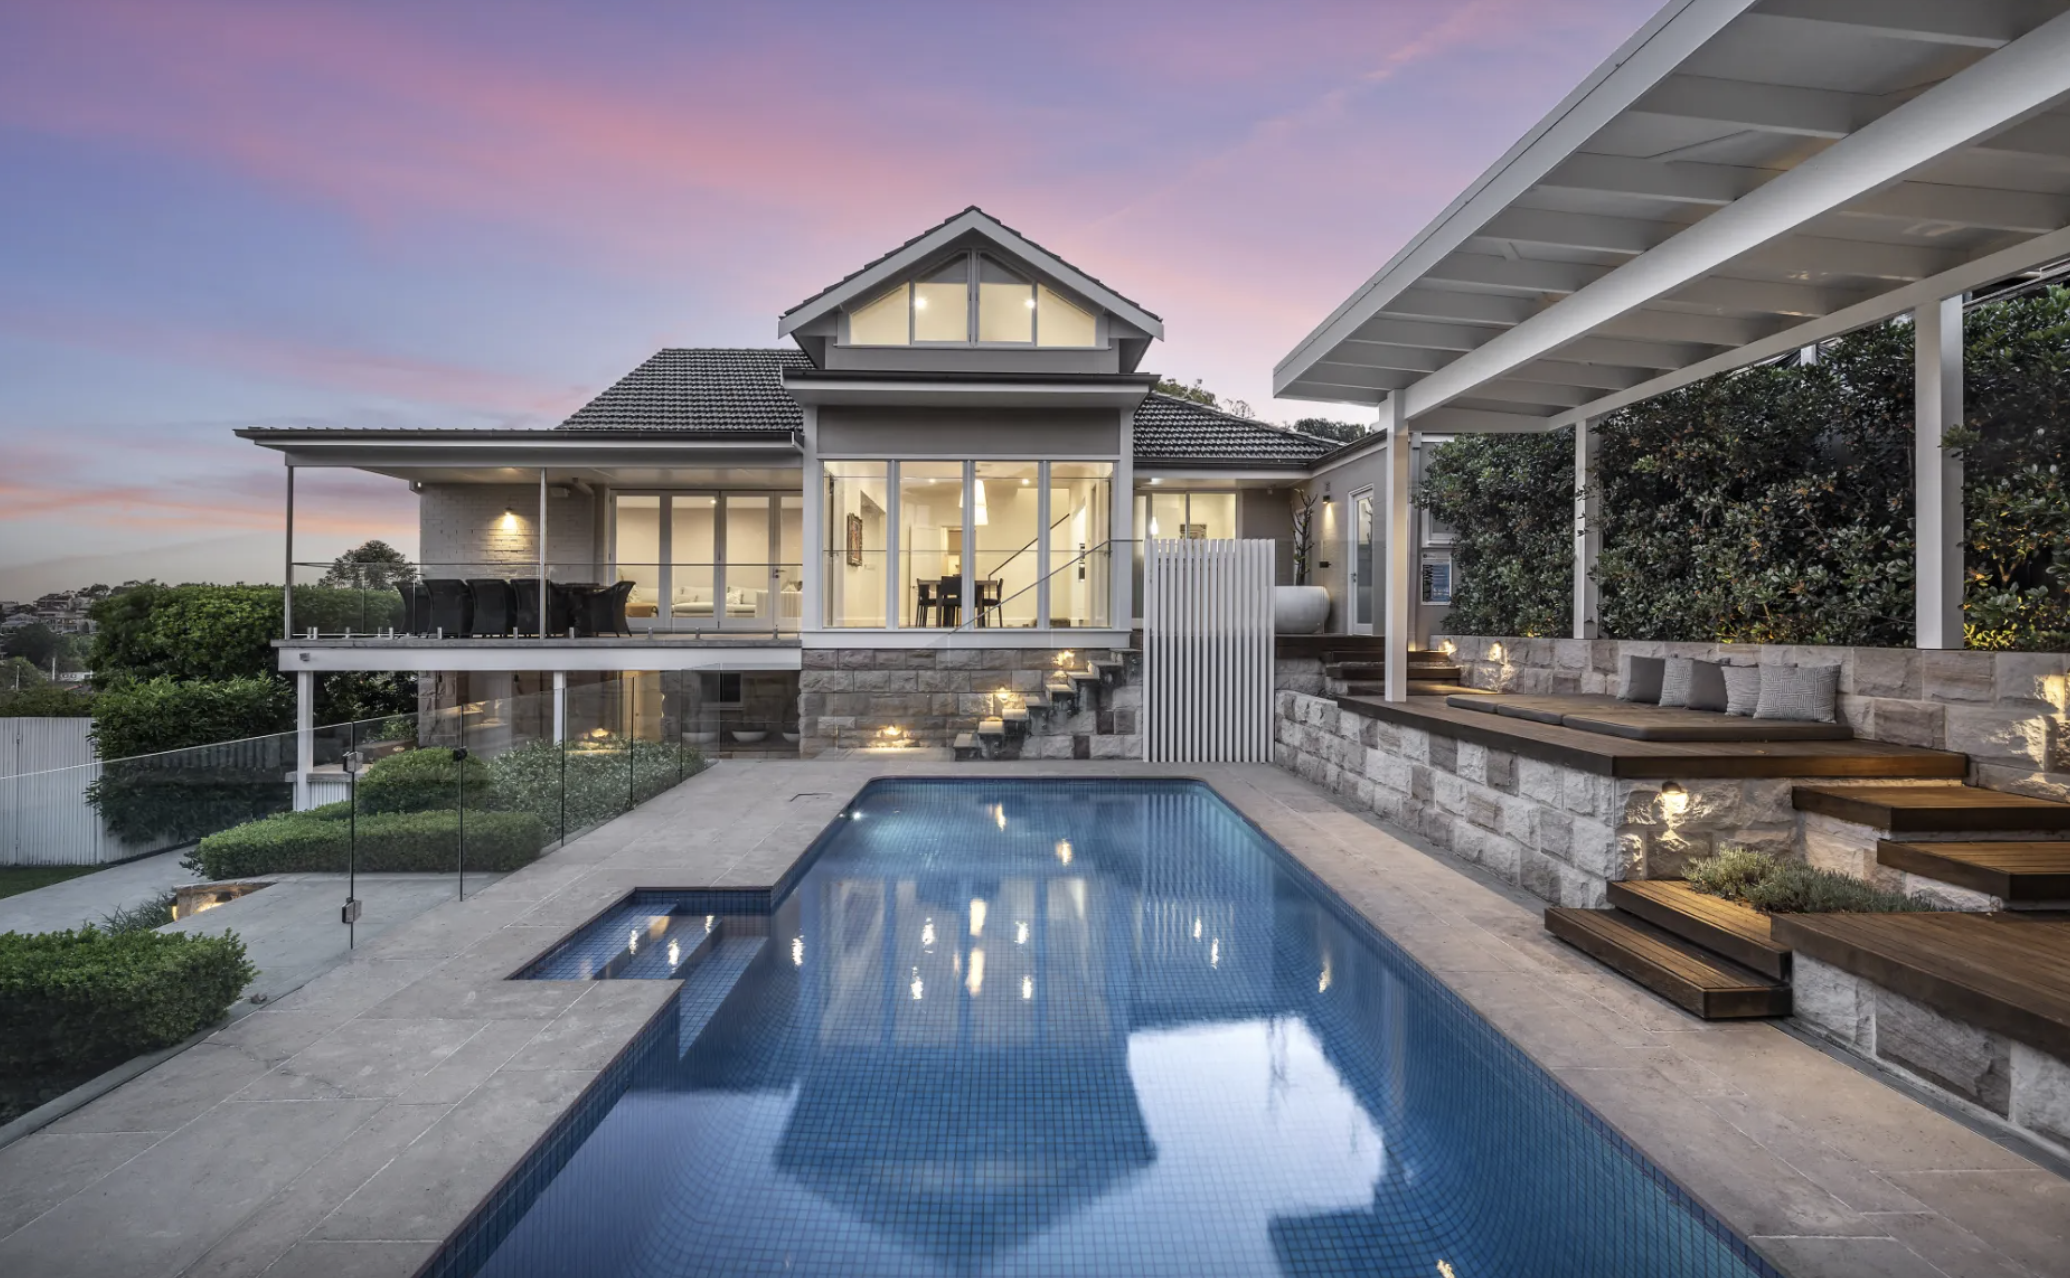
The more nuanced shift Nouh is seeing among sophisticated investors is a move toward assets where both outcomes can be engineered simultaneously – established homes on substantial land in quality locations, where the existing dwelling can be repositioned, rental returns improved, and the underlying land value compounds independent of what sits on it.
For investors with existing equity, commercial property is also entering the conversation in a more serious way.
Prestige industrial assets, medical centres and long-leased essential retail offer income profiles that residential property in most capital city markets cannot currently match: longer lease terms, tenants covering outgoings, and greater predictability than the residential tenancy cycle.
“The investors who build lasting wealth are rarely the ones who chased yield or growth exclusively,” says Nouh.
“They are the ones who built a strategy they could sustain – one that generated enough income to hold quality assets through multiple cycles while those assets compounded in value.”
The budget has changed the settings. It has not changed the fundamentals.

From Italian vegetable-tanned leather to real-world training insight, Australian brand PK9 Gear is redefining what luxury means for discerning dog owners.

Rugged coastal drives and fireside drams define a slow, indulgent journey through Scotland’s far north.