First It Was Quiet Quitting, Now Workers Are Facing Off With Their Bosses
Employee frustrations impact productivity and worker retention, Gallup says

 3 min
3 min
More and more Americans aren’t feeling great at work.
Half of workers aren’t engaged on the job, putting in minimal effort to get by, according to research by Gallup released Tuesday. Employee engagement in the U.S. declined for the second year in a row. There is also a growing share of the workforce that is disengaged, or resentful that their needs aren’t being met. In some cases, these workers are disgruntled over low pay and long hours, or they have lost trust in their employers.
“Employers are just not as in touch with employees,” said Jim Harter, chief workplace scientist at Gallup and lead author on the report. Some of the recent shift in attitude stems from workers having unclear expectations from their managers.
Workers’ frustrations have been building since 2021, after Gallup-measured U.S. worker-engagement levels hit their highest level on record in 2020. In the spring and summer of 2020, as Covid-19 spread and there was social unrest in the wake of George Floyd’s murder, executives at many companies had town halls and listening sessions with employees, communicating organisational mission and keeping workplace relationships strong.
This year, more companies are trying to bring workers back to offices as bosses fret about worker productivity and loyalty.
Gallup surveyed more than 60,000 people in the U.S. to compile the report, which has tracked Americans’ sentiment about their jobs since 2000, and says engaged workers are more productive and tend to stay at their jobs for longer.
“If you feel like your employer isn’t giving you what you need to do your work, you’re going to be much less loyal—and looking for other work,” said Harter.
The remote work divide
Gallup’s findings come amid backlash from workers, many of whom have recently stepped up protests against in-office requirements as companies change pandemic-era policies.
Workers at insurer Farmers Group called to unionise, and some pledged to quit after a new chief executive said he would require most workers to be in-office three days a week. Amazon.com workers demonstrated at lunch recently against a hybrid-work policy with three days in the office a week.
An employee’s relationship with a direct boss is more important to engagement than where people work, said Harter. One way to build these connections is for managers to have meaningful conversations with their employees, preferably at least once a week.
Working on trust
Many employees see shifts away from flexible schedules and remote work options as a signal that executives don’t trust them to do their jobs outside of the office. Others say benefits to remote work they experienced during the pandemic, including more time with family and cutting back commutes, are now critical to their happiness.
The employers making more in-office work a requirement are, in part, motivated by trying to bolster workers’ loyalty, which they correlate with longer retention, said Katy George, a senior partner and chief people officer at McKinsey & Co.
Kyle Pflueger, 34 years old, was hired in 2020 to work remotely as a product manager. He met his co-workers in person just a few times over the years and never felt fully connected to his work or colleagues, but as the breadwinner for his family, he needed the pay, retirement benefits and health insurance.
Pflueger left his full-time job this month to focus on his independent projects.
“I wasn’t feeling particularly happy with the work that I was doing,” he said. He now works full time for himself, building and maintaining websites for businesses.
Looking for less stress
Workers also said they were more stressed this year than last, according to Gallup’s survey. American workers are among the most stressed, tied with workers in Canada and parts of East Asia.
Workplace stressors include low salaries, long hours and a lack of opportunity for advancement, according to an October report from the U.S. Surgeon General. The report also warned that workplace stress can be bad for mental health, disrupt sleep and raise one’s vulnerability to infection.
Michele Spilberg Hart, who directs marketing for a Boston-area health nonprofit, said that she has told her staff to take time off when they aren’t feeling well mentally or physically. Their work isn’t life-or-death, and taking breaks can help people come back with more energy and better ideas, she said.
“They cannot do good work and be healthy if they’re not taking care of themselves first,” she said. “If you don’t take care of yourself, nobody else will.”
 Copyright 2020, Dow Jones & Company, Inc. All Rights Reserved Worldwide. LEARN MORE





Studio apartments have almost disappeared from new Australian developments. Lura is bringing them back to Burleigh Heads from $495,000.

Porsche’s Cayenne Turbo Electric produces up to 1,156PS and reaches 100km/h in a claimed 2.5 seconds.

The ASX 200 gained 0.4 per cent in the week ended 9 October as property and energy rose while technology and small caps declined.
5 min
Heavyweights Lift the ASX as Small Caps and Technology Fall Behind
The S&P/ASX 200 finished the week ended 9 October at 8,716.6, up 0.4 per cent, but the headline concealed a sharply divided market as listed property, energy and selected blue chips advanced while technology, iron ore miners and smaller companies fell.
Australia’s sharemarket finished the week higher, but the gain was less convincing than the index alone suggested.
The S&P/ASX 200 closed Friday, 9 October at 8,716.6, gaining 0.4 per cent over the five trading sessions. The broader All Ordinaries added 0.26 per cent to 8,877.7. By contrast, the Small Ordinaries fell 1.34 per cent to 3,281.9, showing that the market’s progress relied heavily on larger, more liquid companies rather than a broad increase in investor confidence.
The index’s path was uneven. It edged up on Monday, rose 0.57 per cent on Tuesday, slipped 0.09 per cent on Wednesday and lost 0.77 per cent on Thursday before recovering 0.64 per cent on Friday.
That final-session rise of 55.7 points allowed the benchmark to finish the week in positive territory and brought it approximately back to break-even for the calendar year.
The strongest sector was listed property, which gained 3.73 per cent. The move was visible in Goodman Group, one of the market’s largest property securities, which rose 4.82 per cent across the week based on adjusted closing prices.
A-REITs remain sensitive to movements in global bond yields, funding costs and asset valuations, so the sector’s strength indicated a meaningful rotation towards income-producing real assets. It did not eliminate the longer-term questions surrounding office demand, asset valuations, development pipelines or refinancing costs.
Energy gained 2 per cent as Brent crude finished the week around US$101.42 a barrel, up approximately 0.85 per cent. Woodside Energy rose 3.46 per cent over the week, although the sector was far from uniform.
Uranium shares came under pressure on Friday, with several names falling sharply. That demonstrated why a supportive move in the energy index should not be interpreted as a universal signal for every energy commodity or producer.
Technology was the weakest major sector, declining 1.97 per cent over the week despite a substantial rebound on Friday. Pro Medicus, WiseTech Global and Life360 all rallied in the final session after suffering sizeable drawdowns from their August levels. The late recovery softened the weekly damage without erasing the market’s broader caution towards higher-valuation growth shares.
Materials also struggled. BHP fell 0.44 per cent over the week, Rio Tinto lost 1.48 per cent and Fortescue declined 5.25 per cent. The size of those companies meant their weakness offset part of the support supplied by property, energy and healthcare.
The banks were another drag. Commonwealth Bank fell 1.43 per cent, Westpac declined 1.75 per cent, National Australia Bank lost 2.13 per cent and ANZ eased 0.51 per cent.
Macquarie Group moved in the other direction, gaining 1.12 per cent. With the major banks representing an unusually large share of the Australian index, even modest simultaneous falls can materially restrain the benchmark.
Healthcare provided some of the strongest large-cap performances. CSL rose 4.84 per cent and ResMed gained 2.49 per cent. General insurer QBE advanced 5.63 per cent, making it the strongest performer among the 20 large-cap companies tracked below.
Consumer-facing companies also contributed. Woolworths rose 3.23 per cent, Coles gained 1.22 per cent and Wesfarmers added 1.48 per cent. Aristocrat Leisure finished 2.91 per cent higher. Those gains helped balance the losses across the banks and diversified miners.
How the ASX’s top 20 moved
The following figures compare adjusted closing prices on Friday, 2 October with Friday, 9 October. Percentages have been rounded to two decimal places.
The top 20 is based on the largest-company framework used for this wrap. Rankings can change with share prices, index reviews and corporate actions.
Commonwealth Bank (CBA): Down 1.43 per cent, from $151.45 to $149.29.
BHP Group (BHP): Down 0.44 per cent, from $61.21 to $60.94.
Westpac Banking Corporation (WBC): Down 1.75 per cent, from $34.32 to $33.72.
National Australia Bank (NAB): Down 2.13 per cent, from $38.50 to $37.68.
ANZ Group (ANZ): Down 0.51 per cent, from $37.37 to $37.18.
Wesfarmers (WES): Up 1.48 per cent, from $76.22 to $77.35.
Macquarie Group (MQG): Up 1.12 per cent, from $245.63 to $248.37.
CSL (CSL): Up 4.84 per cent, from $175.35 to $183.84.
Woodside Energy (WDS): Up 3.46 per cent, from $31.24 to $32.32.
Rio Tinto (RIO): Down 1.48 per cent, from $164.81 to $162.37.
Goodman Group (GMG): Up 4.82 per cent, from $25.91 to $27.16.
Woolworths Group (WOW): Up 3.23 per cent, from $38.35 to $39.59.
Telstra Group (TLS): Down 1.24 per cent, from $4.83 to $4.77.
Fortescue (FMG): Down 5.25 per cent, from $16.19 to $15.34.
Coles Group (COL): Up 1.22 per cent, from $23.03 to $23.31.
Northern Star Resources (NST): Up 1.54 per cent, from $24.02 to $24.39.
QBE Insurance Group (QBE): Up 5.63 per cent, from $23.81 to $25.15.
Aristocrat Leisure (ALL): Up 2.91 per cent, from $59.76 to $61.50.
ResMed (RMD): Up 2.49 per cent, from $31.79 to $32.58.
James Hardie Industries (JHX): Up 0.06 per cent, from $36.07 to $36.09.
The Top 20 results show why the overall index could advance despite weakness in the banks and miners. Eleven of the 20 companies finished higher, but more importantly, several of the gains were substantial.
QBE, CSL and Goodman rose close to or above 5 per cent, while Woodside and Woolworths advanced more than 3 per cent. Those moves countered falls across all four major banks and the three largest diversified iron ore exposures.
Fortescue was the weakest company in the group, down 5.25 per cent. National Australia Bank recorded the largest decline among the major banks, while Rio Tinto was the weaker of the two larger diversified miners after Fortescue.
It is important not to invent a company-specific explanation where none was confirmed. Some weekly movements reflected sector rotations, commodity prices, interest-rate expectations and changes in investor positioning rather than a fresh announcement by the company.
Where no material ASX announcement clearly explained the move, the percentage should be treated as market performance rather than evidence of a particular event.
Weekly market dashboard
Trading week: 5–9 October 2026.
S&P/ASX 200: 8,716.6, up 0.40 per cent.
All Ordinaries: 8,877.7, up 0.26 per cent.
Small Ordinaries: 3,281.9, down 1.34 per cent.
Best sector: Listed property, up 3.73 per cent.
Weakest sector: Information technology, down 1.97 per cent.
Energy: Up 2.00 per cent.
Brent crude: Approximately US$101.42 a barrel, up 0.85 per cent.
AUD/USD at Friday’s close: Approximately US69.81 cents.
Strongest tracked large cap: QBE Insurance, up 5.63 per cent.
Weakest tracked large cap: Fortescue, down 5.25 per cent.
What investors will watch next
The immediate question is whether the rally can broaden. A market supported by a handful of large companies can continue rising, but it is more vulnerable if those leaders reverse.
Improvement in the Small Ordinaries and technology sector would provide stronger evidence that investors are becoming comfortable taking risk beyond defensive and income-producing assets.
Oil remains another major variable. Prices above US$100 a barrel can support producers such as Woodside, but they also increase transport, manufacturing and household costs. That creates a complicated backdrop for inflation and interest-rate expectations.
Global bond yields, US earnings and local company announcements will also shape the coming week. For Australian investors, the concentration of the domestic market means movements in the banks, BHP, Rio Tinto, CSL, Wesfarmers, Goodman and Woodside can overwhelm an otherwise mixed session.
The week’s 0.4 per cent gain was constructive, but it was not a declaration that risk had disappeared. The more accurate reading is that investors favoured selected large companies, listed property, energy and defensive consumer names while remaining cautious about smaller companies, technology and iron ore exposure.
That distinction matters. An investor whose portfolio resembled the headline index may have finished ahead. Someone weighted towards smaller companies, technology or bulk miners may have experienced a very different week.
This article provides general information only. It does not constitute personal financial advice or a recommendation to buy, sell or hold any security. Market prices and index composition can change rapidly.

A 30-metre masterpiece unveiled in Monaco brings Lamborghini’s supercar drama to the high seas, powered by 7,600 horsepower and unmistakable Italian design.
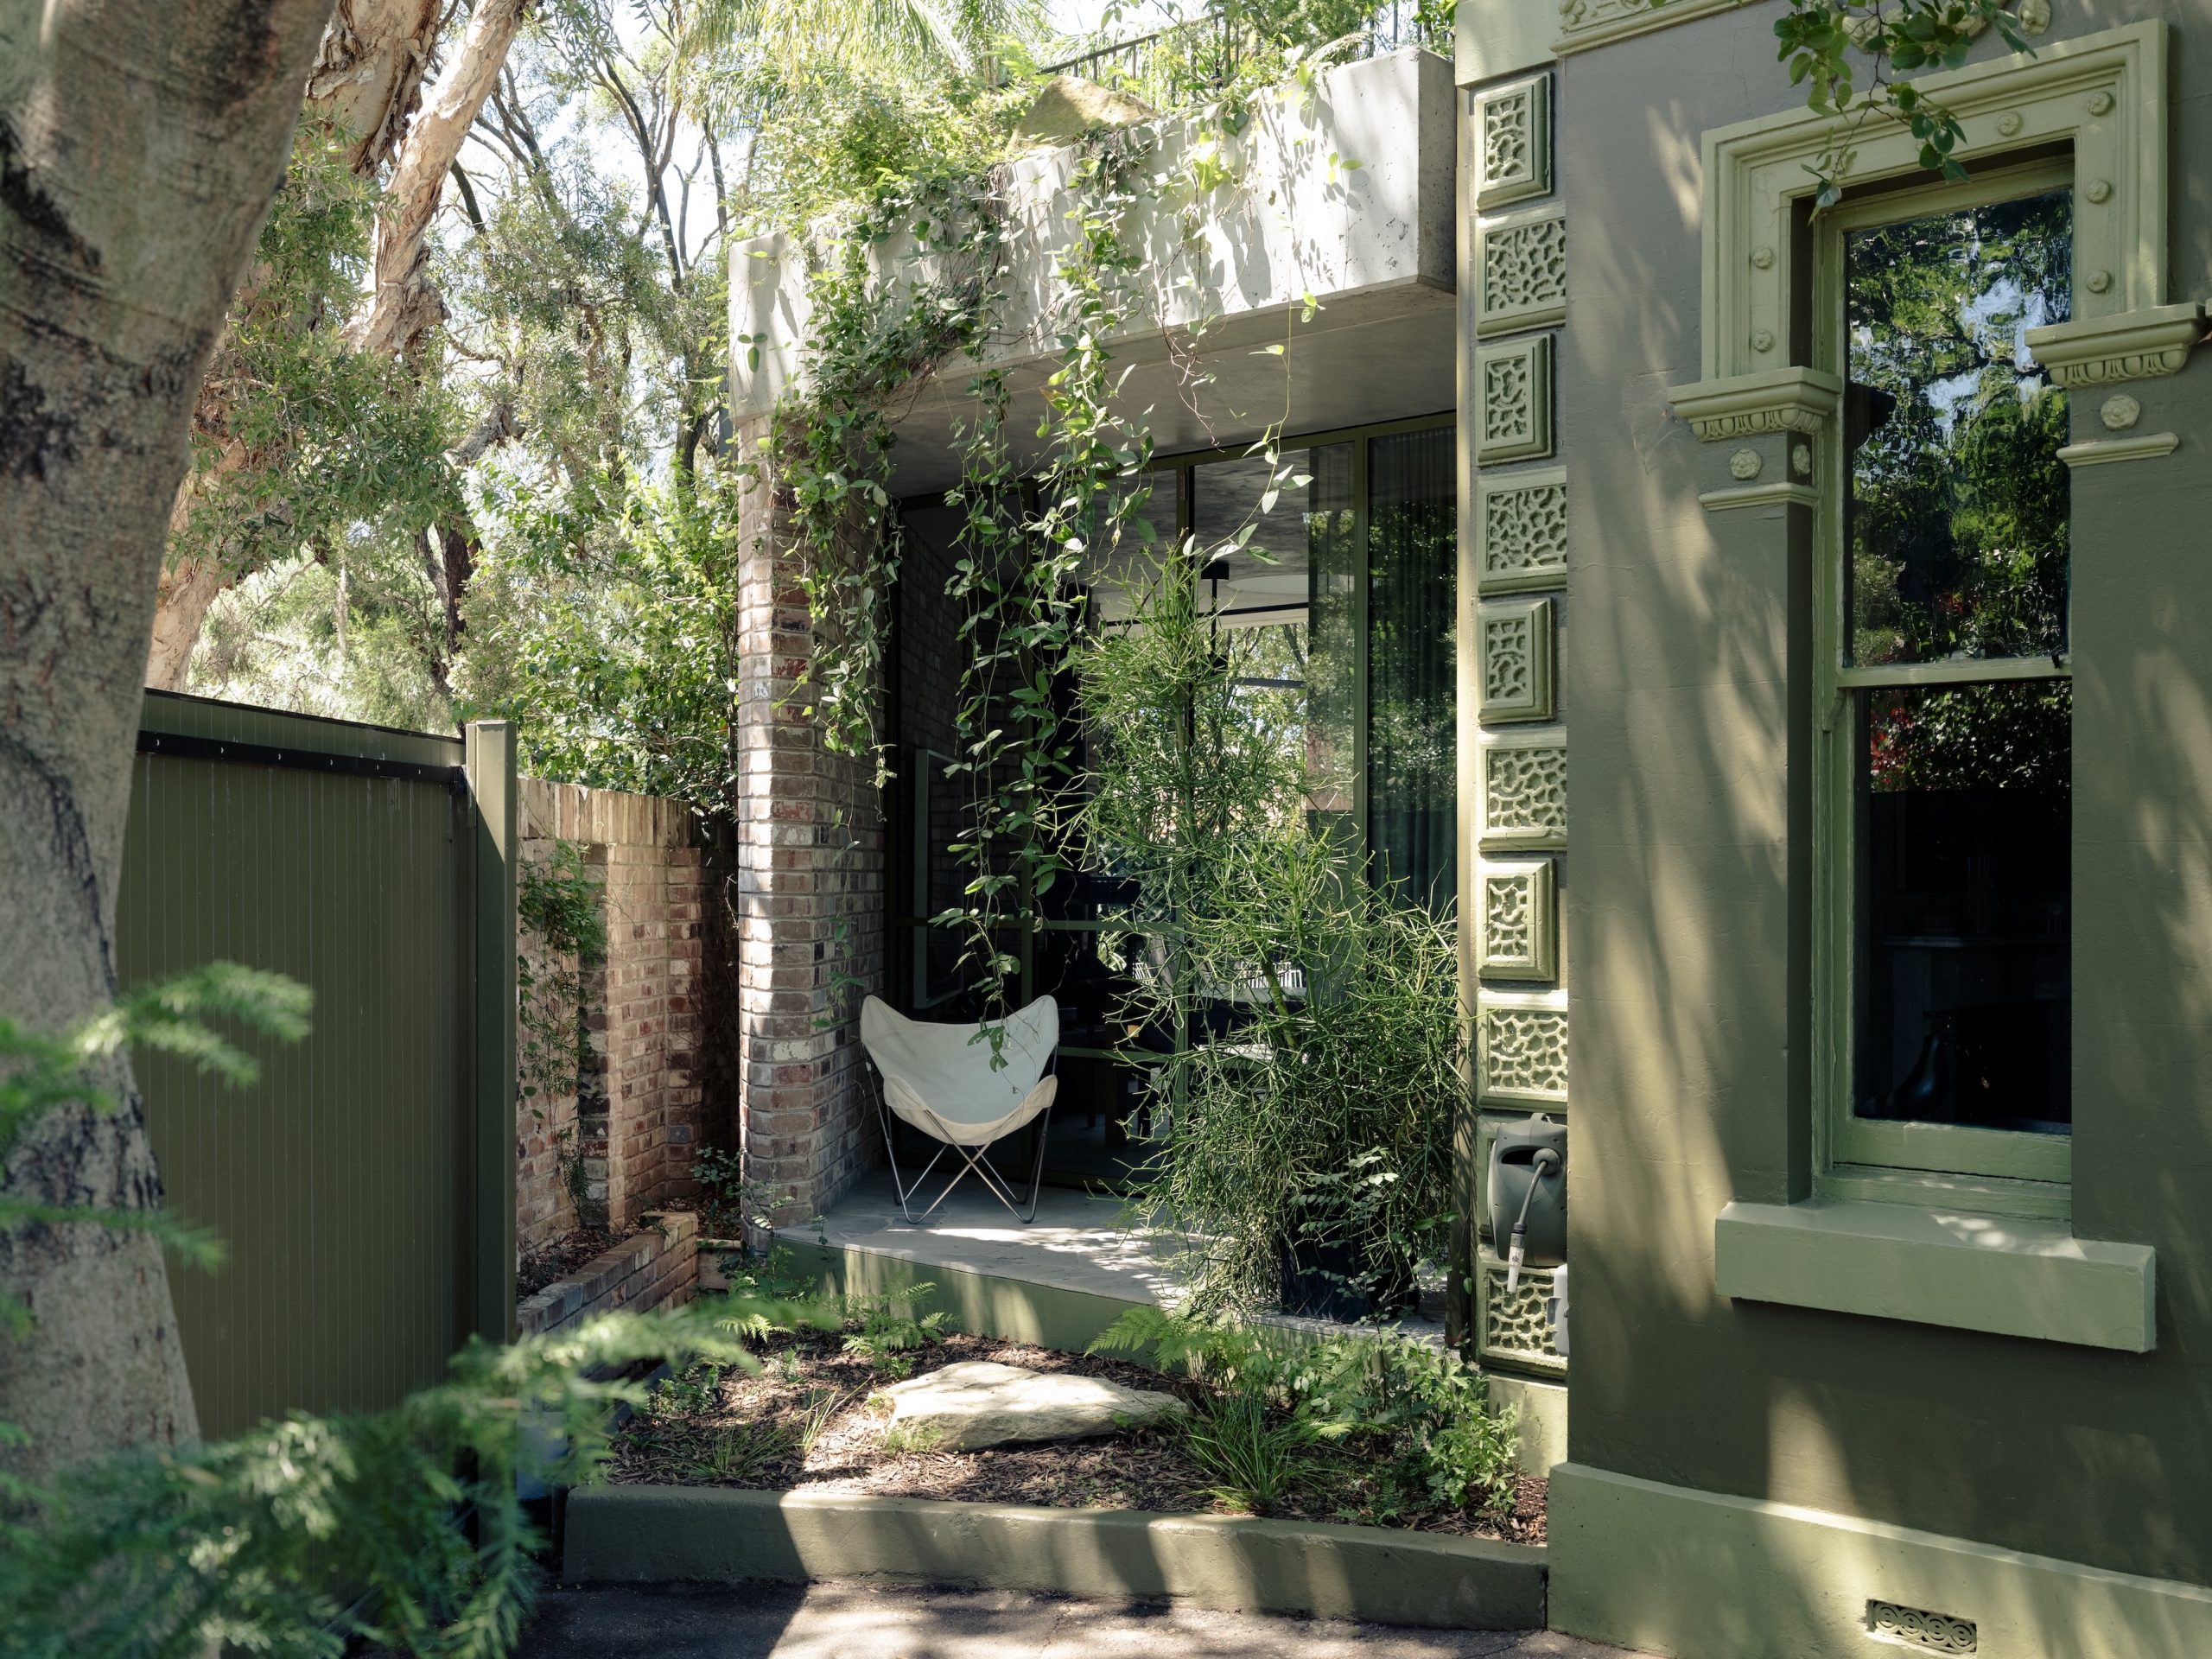
From bushland greens to valley reds, the country’s most awarded designers are proving that the best colour palette was never on a swatch card; it was outside the window all along.