Meet the CEOs Who Pull In More Than $100 Million a Year
Chief executives at Pinterest, Peloton and Hertz are outearning Apple’s Tim Cook—and hundreds of others leading bigger companies

 4 min
4 min
The highest-paid CEOs aren’t always the ones running the biggest companies.
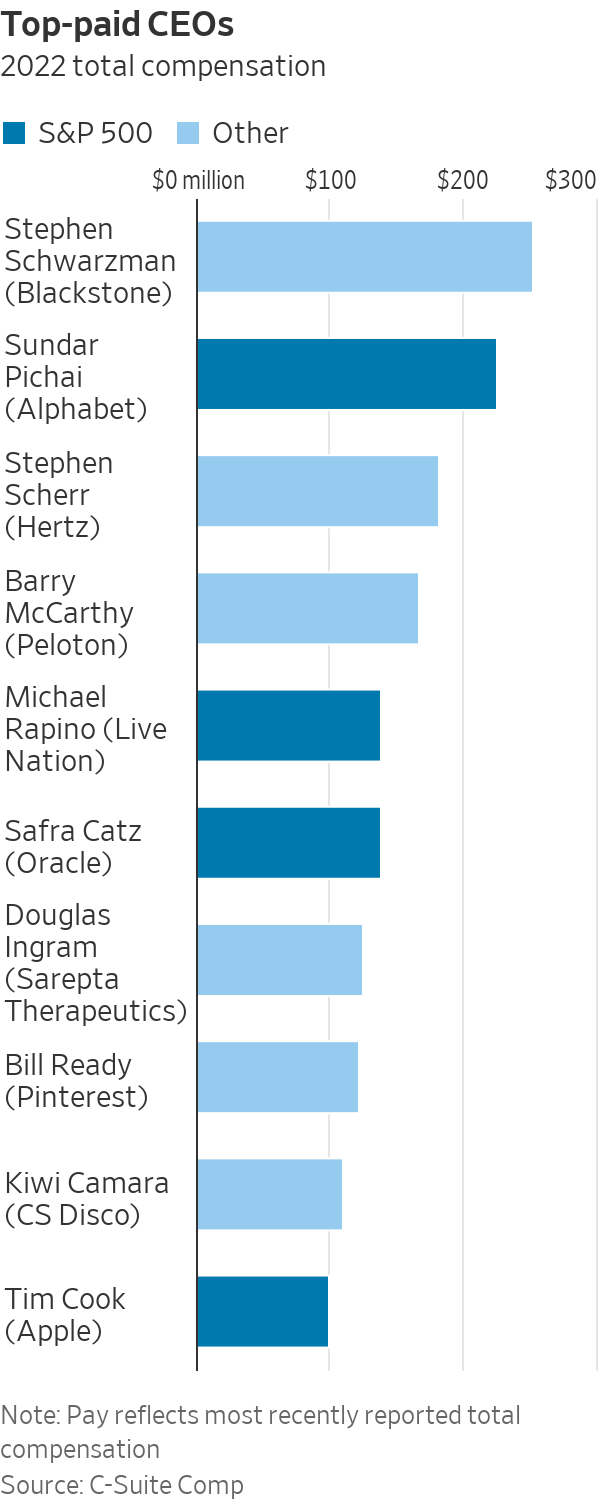
The chief executives of Hertz, Peloton and Pinterest all earned more than $100 million in 2022, topping almost every CEO in the S&P 500 including Apple’s Tim Cook, who made $99 million. Also on that list: The man who runs CS Disco, a cloud-services provider that caters to attorneys and has a market capitalisation of about $500 million.
Six of the 10 highest-paid CEOs last year ran companies that weren’t in the S&P 500, according to C-Suite Comp, an executive-pay-data and analytics company. The S&P 500 comprises most of the biggest U.S. publicly traded companies.
Stephen Schwarzman of private-equity giant Blackstone earned the biggest pay package overall, at $253 million. Blackstone, larger than many S&P 500 companies at a market capitalisation of more than $100 billion, has a corporate structure similar to dual share-class setups that until recentlyhave kept other companies out of the index.
Schwarzman edged out Sundar Pichai, who runs Google parent Alphabet and received a pay package of $226 million—a total that put Pichai atop The Wall Street Journal’s annual CEO pay survey earlier this year. Pichai was followed in the earlier survey by Live Nation’s Michael Rapino, at $139 million.
Some executives in C-Suite Comp’s top-paid list, such as the leaders of Pinterest and Hertz, wouldn’t make the Journal’s annual pay ranking because those CEOs started during the year. The Journal’s analysis only ranks CEOs who served the full year.
Median pay for CEOs of S&P 500 companies slipped to $14.5 million last year, from $14.7 million the year before.
More broadly, nine CEOs made more than $100 million in 2022, of nearly 4,000 publicly traded U.S. companies in C-Suite Comp’s analysis. That is down from more than 20 a year earlier, as equity awards slimmed down, the firm said.
The bulk of CEO pay usually consists of restricted stock or options, the value of which can fluctuate. Many equity awards often only vest—becoming fully the executive’s property—if certain performance targets are met, or if the executive remains employed for a specified period.
For Schwarzman, Blackstone’s co-founder, about $190 million of his pay came in the form of carried interest and incentive-fee allocations. Carried interest refers to a cut of profit above a target that some investment managers receive. A further $58.8 million consisted of shares in real-estate investment trusts that Blackstone manages.
Schwarzman’s total pay was more than 50% larger than his 2021 package of $160 million. Total return for Blackstone shares, including the company’s dividend, was minus 40% last year, compared with minus 18% for the S&P 500. Through late June this year, Blackstone’s total return was 22%, compared with about 14% for the index.
Schwarzman owns almost 20% of Blackstone, a stake qualifying for dividends of about $1 billion in 2022.
A Blackstone spokesman said nearly 30% of Schwarzman’s 2022 pay reflects investment performance in 2021, in a period when the company’s share price also doubled. “Virtually all his compensation is carried interest and incentive fees—which are only paid when we deliver for our customers,” the spokesman said. He declined to say how much of Schwarzman’s pay was in cash.
At Hertz, Stephen Scherr’s total pay of $182 million included $3.4 million in salary and bonus. A further $178 million in restricted stock is structured to vest through 2026, much of it only if the company’s shares reach 90-day average price targets ranging up to nearly double its current share price.
In its annual proxy statement, Hertz said two price targets had already been met, meaning about $50 million in shares at recent prices stand to vest if Scherr stays employed through 2026, in addition to roughly $20 million that vested on Dec. 31.
Scherr, who earlier worked as Goldman Sachs Group’s chief financial officer, took Hertz’s top job in February 2022, about seven months after the rental-car chain emerged from bankruptcy-court protection.
Hertz shares fell 22% during Scherr’s tenure last year, while the S&P 500 fell 16%. The company valued Scherr’s equity award at roughly $128 million at year-end, securities filings show. Hertz shares were up about 20% this year through June 30.
A Hertz spokesman declined to comment beyond company disclosures.
Peloton’s Barry McCarthy started as CEO in February 2022, after stints as chief financial officer at Spotify and Netflix. His $168 million pay package at Peloton was almost entirely in stock options, which vest monthly over four years.
With Peloton trading near $7.50 in recent days, those eight million options are underwater, meaning they would cost more to exercise than the underlying shares are worth.
Peloton shares have fallen about 3% this year through June 30, and fell 79% in 2022 as declining demand left the company with a glut of the exercise bikes it sells.
Peloton representatives didn’t respond to requests for comment.
Of the $123 million Pinterest awarded Bill Ready last year, nearly $101 million came in stock options and $21.5 million in restricted stock made up most of the rest. Both were awarded in connection with his hiring as CEO in late June 2022.
The equity awards vest quarterly over four years if Ready remains employed. By year-end, Ready’s 2022 stock and option awards had increased in value to $153.6 million, Pinterest said in its securities filings.
Pinterest shares rose just over 20% last year. So far this year, Pinterest shares have risen about 13% through June 30.
A Pinterest spokeswoman said Ready isn’t expected to receive additional equity during his first four years, and the company sees his 2022 equity awards as the equivalent of about $30 million a year over that time. Ready also had to buy and hold $5 million in shares.
“If the company performs well, then Bill’s options have value,” the spokeswoman said. “If the company doesn’t perform well, then Bill’s compensation is going to be impacted.”
CS Disco, a 10-year-old Austin, Texas, company that sells online services to law firms, attorneys and legal-services companies, is the smallest company in the top-paid set. CEO Kiwi Camara, a co-founder, received $500,000 in salary plus stock options valued at $109 million, an award shareholders approved in a vote last year.
Camara’s options vest only if the company’s 90-day average share price reaches any of six targets through 2032, or if the company is acquired or Camara loses his job under certain circumstances.
Camara earned just under $1 million total in 2021, the year the company went public in late July. Its shares closed at $8.22 on Friday, up 30% for the year so far but down more than 75% from the company’s share price at the start of 2022.
CS Disco didn’t respond to requests for comment.
 Copyright 2020, Dow Jones & Company, Inc. All Rights Reserved Worldwide. LEARN MORE


Brickworks has enlisted acclaimed architecture studio Kennedy Nolan to explore how homes could become more adaptable, energy-efficient and connected to community.

Ophora Tallawong has launched its final release of quality apartments priced under $700,000.


With US$40 million already committed, the Global Talent Fund is attracting investor attention with a strategy focused on building globally scalable consumer brands alongside high-profile talent.
2 min
A new investment fund targeting celebrity-founded consumer brands has secured US$40 million in commitments and is rapidly approaching its US$50 million fundraising target, signalling growing investor appetite for alternative opportunities beyond traditional asset classes.
The Global Talent Fund, which has a maximum raise of US$100 million, focuses on building and investing in consumer businesses alongside celebrities, athletes, and influential personalities who play an active role as co-founders rather than simply endorsing products.
The strategy is based on the belief that changes in consumer behaviour, particularly the rise of social media and digital engagement, have fundamentally altered how brands are built and scaled.
GTF founding partner Jeremy Hunt, who is helping lead the fund’s strategy, said consumers increasingly feel connected to personalities they follow online and are more willing to support products developed by those individuals.
“Consumers are searching for content to engage with, and when a celebrity they like or follow takes them on the journey of creating a product or brand, they genuinely feel part of that process,” he said.
The fund is targeting high-growth consumer sectors including wellness, hydration, beauty and recovery, areas Hunt believes continue to benefit from strong global demand and ongoing innovation.
Rather than backing celebrity endorsement deals, the fund is seeking businesses where talent is deeply involved in product development, brand creation and long-term growth.
According to Hunt, authenticity remains one of the biggest differentiators between successful celebrity-backed brands and those that fail.
“The consumer can see clearly if someone is simply being paid to promote a product,” he said. “The winners are typically the brands where the celebrity has genuinely helped build the business from the ground up.”
The model has attracted support from several prominent Australian investors and business families, reflecting broader interest in alternative investments with global growth potential.
Hunt said consumer brands offered a level of tangibility that many investors found appealing.
“Consumer brands are what we touch, feel, smell and taste every day,” he said. “Our investors understand the growth potential in the model, but they also want to be part of the journey.”
The fund’s rapid progress towards its fundraising target comes amid growing recognition that celebrity influence, when combined with strong commercial execution and scalable business models, can create significant enterprise value.
With several high-profile celebrity-founded businesses generating billion-dollar exits in recent years, supporters of the strategy believe the opportunity remains in its early stages.
For more information, contact marc@kanerbridge.com.au

From Tokyo backstreets to quiet coastal towns and off-grid cabins, top executives reveal where they holiday and why stepping away makes the grind worthwhile.
Australia’s market is on the move again, and not always where you’d expect. We’ve found the surprise suburbs where prices are climbing fastest.