More Americans Than Ever Own Stocks
Pandemic, zero-commission trading ‘created a whole generation of investors’

 4 min
4 min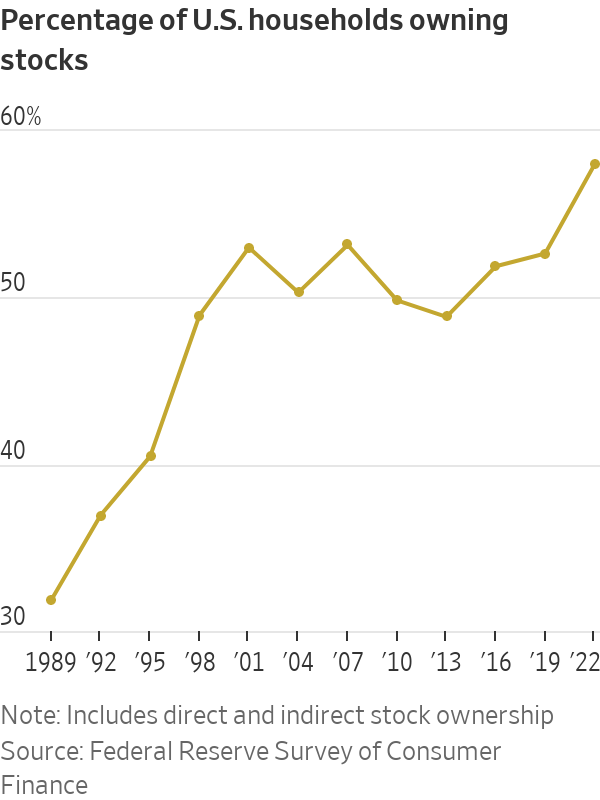
The share of Americans who own stocks has never been so high.
About 58% of U.S. households owned stocks in 2022, according to the Federal Reserve’s survey of consumer finances released this fall. That is up from 53% in 2019 and marks the highest household stock-ownership rate recorded in the triennial survey. The cohort includes families holding individual shares directly and those owning stocks indirectly through funds, retirement accounts or other managed accounts.
The data provide the most comprehensive snapshot yet of how the Covid-era explosion in investing has reshaped Americans’ personal finances. Stuck at home during the pandemic with extra cash, millions jumped into the stock market for the first time. The elimination of commission fees on stock trading across U.S. brokerages made investing cheaper than ever.
“It created a whole generation of investors,” said Anthony Denier, chief executive of mobile brokerage Webull U.S.
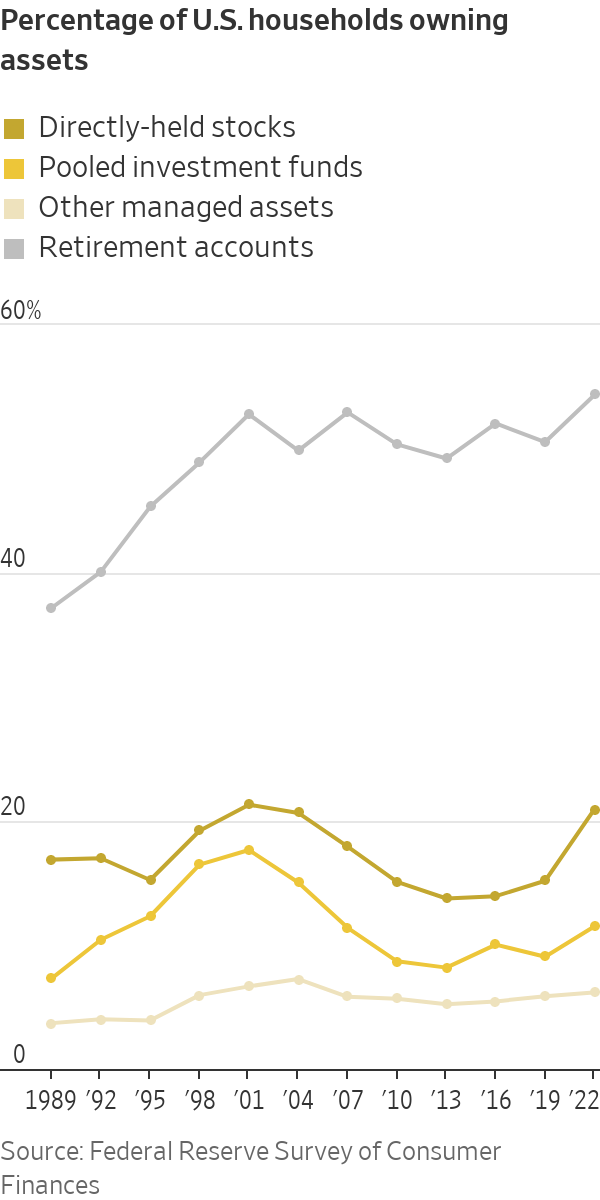
Most households own stocks through a retirement account, such as a 401(k), but more Americans in the past few years have invested in individual shares directly. Direct stock ownership increased to 21% of families in 2022 from 15% in 2019—the largest increase on record since the survey began in 1989.
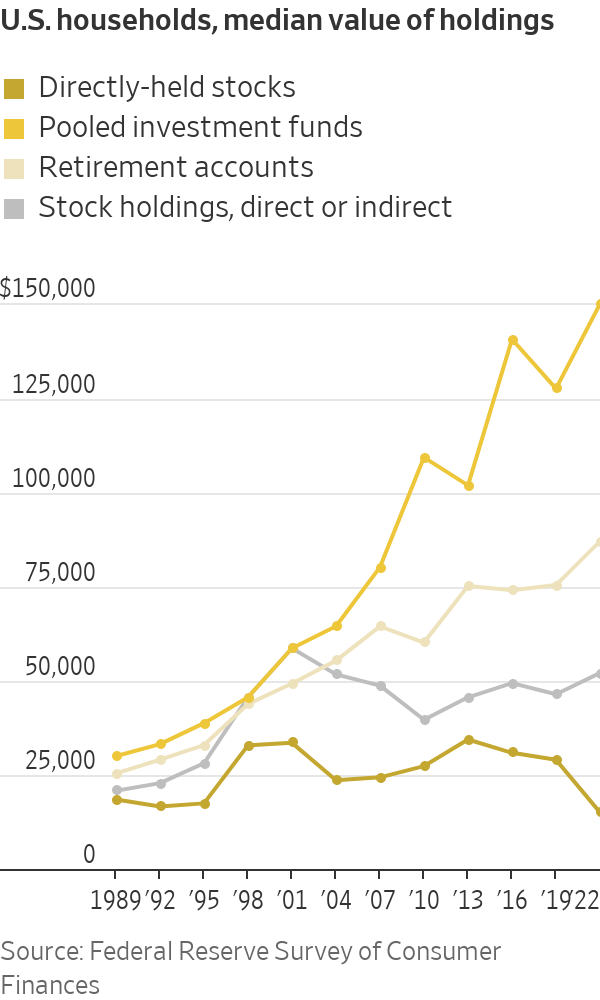
As more households bought individual shares, those newer entrants invested with less money than longtime stockholders. The median value of households’ direct stockholdings nearly halved from 2019 to about $15,000 in 2022, adjusted for inflation.
When the stock market crashed in early 2020, Nick Luczak, then a sophomore at the University of Michigan, used the $57 in his checking account to open a brokerage account on Robinhood and buy whichever stocks he could afford. Once the pandemic forced him off campus to live with his parents, he began researching the market and buying more stocks.
“I said, ‘Well, I have all this spare time. There’s no reason at all I shouldn’t be trying to make the most money possible from this,’” Luczak said.
Luczak and his fraternity brothers started a group chat to discuss markets and stock picks. He said he made a profit investing in Amazon.com and watched his friends make, then lose, thousands of dollars trading meme stocks such as GameStop and AMC Entertainment Holdings in 2021. At one point, he considered becoming a day trader.
Now, Luczak, 24 years old, is focused on long-term investing. A salesman in Dallas, he is studying to become a certified financial planner.
Brokerages in recent years have made trading free and easy. Newer apps like Robinhood and Webull helped popularise zero-commission stock trading on smartphones. Charles Schwab, TD Ameritrade and E*Trade all eliminated commission fees for stocks at the end of 2019. Fidelity and Schwab introduced fractional stock trading in 2020, allowing individuals to buy and sell slivers of shares.
“It’s become more accessible,” said Ashley Feinstein Gerstley, a certified financial planner and founder of The Fiscal Femme. “We’ve been debunking in the last few years the myth that you have to be rich or work on Wall Street to invest.”
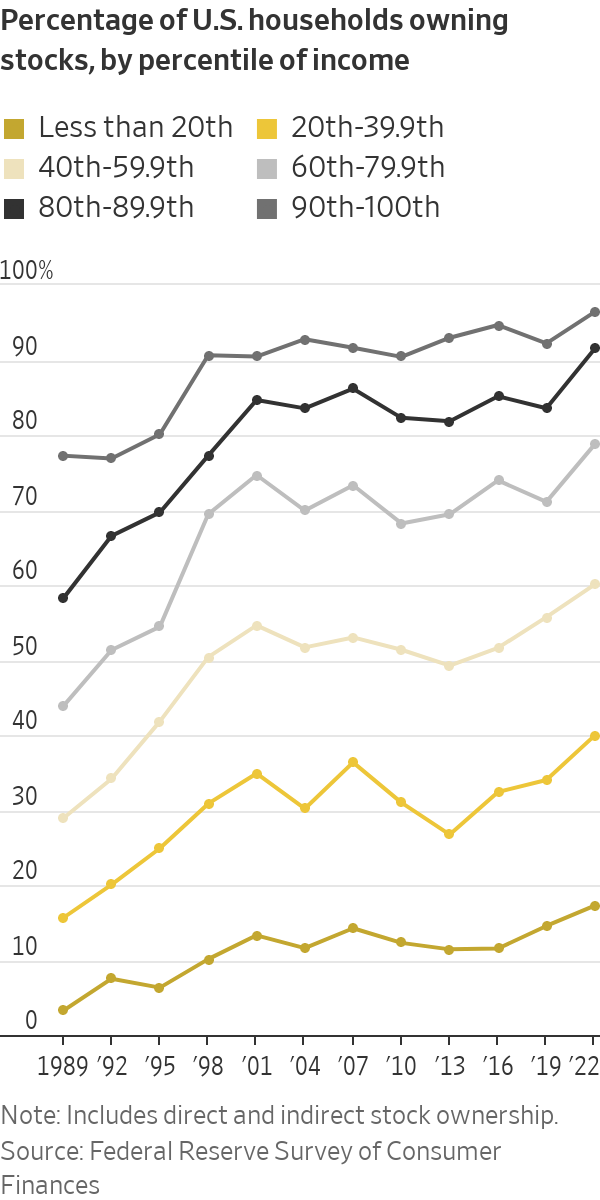
The share of households owning stocks increased across all income levels from 2019 to 2022. Upper-middle-income families recorded the biggest jump in stock ownership.
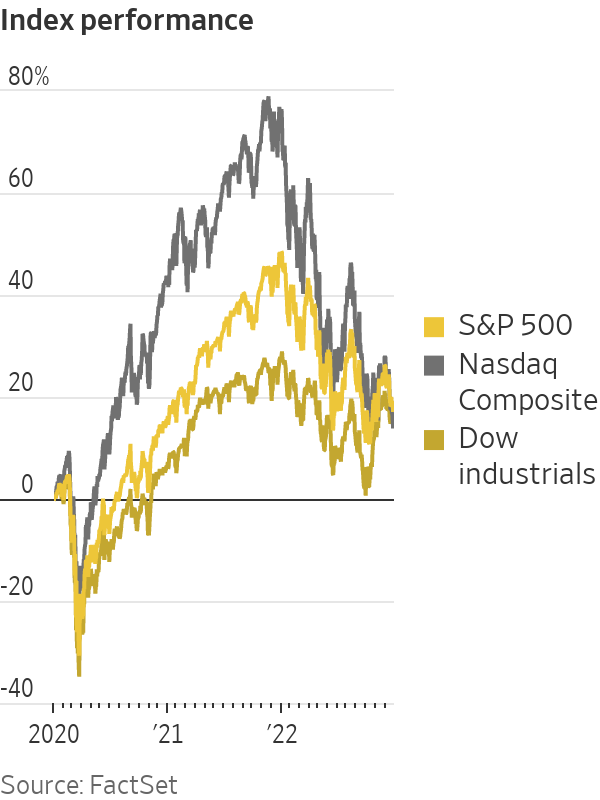
Over those three years, stocks climbed to new highs. The S&P 500 rose 16% in 2020 and 27% in 2021. Even after a 19% drop last year, the benchmark stock index notched gains over the three-year period. The S&P 500 is up 23% in 2023.
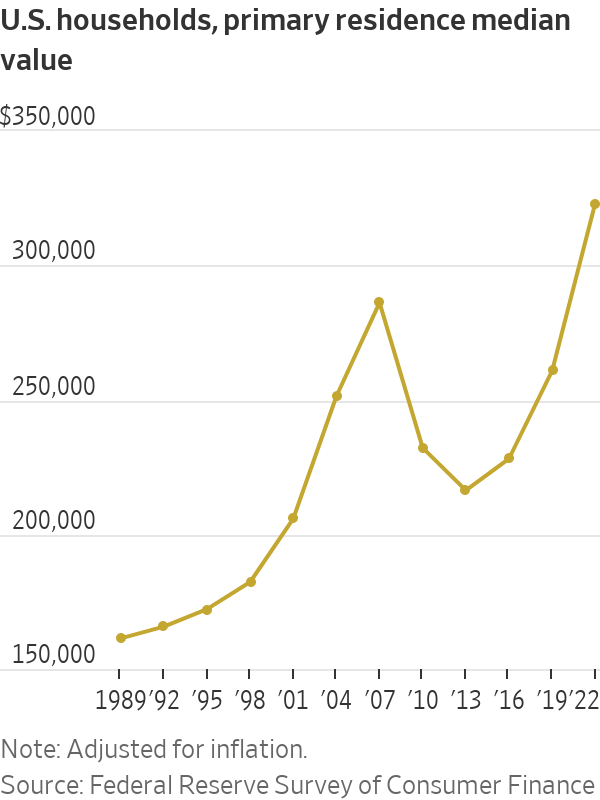
Stock-market gains and rising home prices helped boost household wealth. Households’ median net worth climbed 37% from 2019 to 2022, adjusted for inflation, the largest increase in the survey’s history. The median value of a U.S. household’s primary residence surged to $323,200 in 2022, surpassing levels from before the 2007 housing market crash.
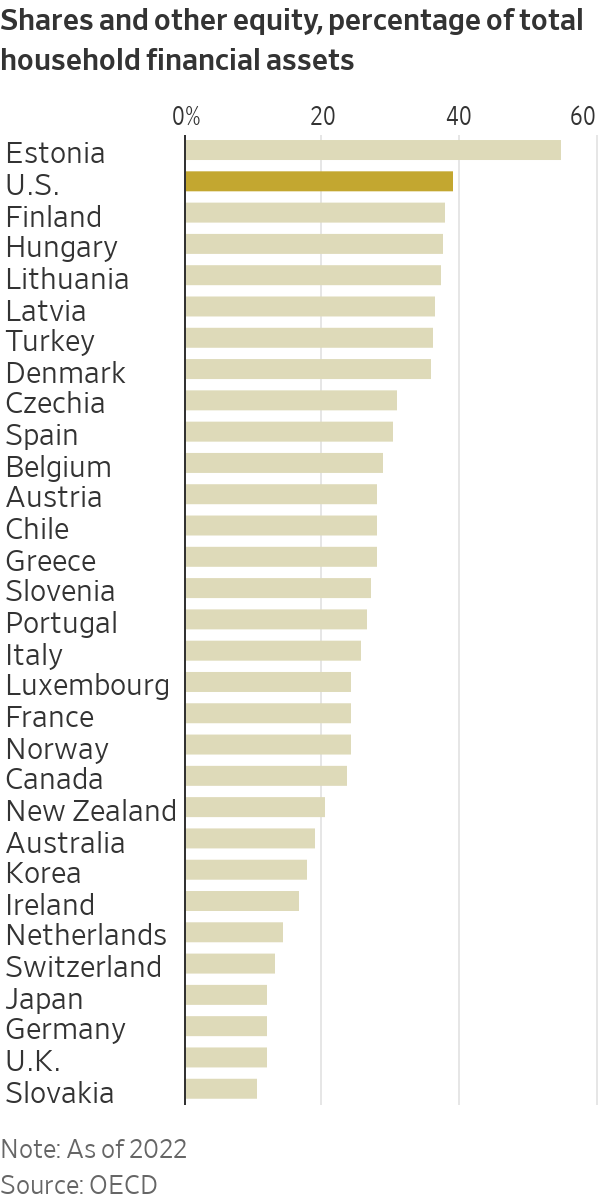
Americans’ penchant for stocks is distinct. U.S. households held about 39% of their financial assets in equities in 2022, according to Organization for Economic Cooperation and Development data, a higher allocation than most other countries in the data set.
That appetite for stocks has been tested since the Fed began raising interest rates last year at the fastest clip since the 1980s and pledged to keep rates higher for longer. Investors have been flocking to assets with little risk such as money-market funds that are now offering some of the highest yields in years. Everyday investors, who rarely own bonds directly, are taking a second look at assets such as Treasurys and corporate bonds.
Fernando Soto, head of private banking in Chicago at Brown Brothers Harriman, said he has fielded more questions from clients about fixed-income investing and more requests from clients to buy bonds in 2023. In his personal portfolio, he increased his allocation to fixed-income this year.
“There’s a big shift,” Soto said. “This is the new normal.”
How has the higher rate environment shifted American household finances? The Fed consumer finance survey in 2025 will likely paint the fullest picture.
 Copyright 2020, Dow Jones & Company, Inc. All Rights Reserved Worldwide. LEARN MORE


A record-breaking $11 million sale at The Centennial Collection has set a new benchmark for luxury apartment living in Bondi Junction.

As interest rates, inflation and market sentiment fluctuate, investors are being urged to focus on data, not panic.


The Federal Budget may have softened some of its proposed tax reforms, but it has exposed a bigger issue: too many families are relying on wealth structures that no longer reflect the realities of modern life.
3 min
For many Australians, the 2026 Federal Budget initially felt like a direct challenge to the way wealth is created, held and transferred between generations.
The headlines were immediate: changes to capital gains tax, reforms to discretionary trusts, restrictions on negative gearing and increased scrutiny of investment structures. Unsurprisingly, affluent families, business owners and investors began asking the same question:
Is the way we hold our wealth still fit for purpose?
In recent days, the government has announced several significant amendments following industry consultation and public feedback, including exempting testamentary trusts from the proposed 30 per cent minimum tax and expanding capital gains tax concessions for small businesses.
The backdown is welcome. But it also highlights something much bigger.
This Budget has accelerated a conversation that many Australian families have been postponing for years.
The conversation is not really about tax. It is about wealth stewardship.
For decades, Australians have built wealth through businesses, property, investments and careful long-term planning. Yet many families have not revisited the legal structures surrounding those assets in years, sometimes decades.
We often see clients who have spent years building significant wealth, only to discover their legal arrangements no longer reflect their current circumstances.
Their children are now adults. They may own multiple properties.
They may have sold a business, entered a second marriage, become grandparents or accumulated digital assets that did not exist when their original estate plans were prepared.
The trust that distributes income may need to be reconsidered. The bucket company may no longer be so attractive.
The Budget has simply exposed a reality that already existed: wealth structures cannot remain static while life continues to evolve.
Importantly, trusts themselves are not the issue.
Trusts are legitimate planning tools that provide flexibility, protection and continuity. When used appropriately, they allow families to adapt to changing circumstances over time.
And neither is tax the issue, really. Getting the fundamentals right is more important for long-term, sustainable wealth than a few favourable tax treatments around the edges.

The real issue is complacency.
Too often, families create structures and assume the job is done. It isn’t.
Estate planning is no longer a document you sign once and file away in a drawer. It is an ongoing process that should evolve alongside your life.
We are also seeing a broader shift in how Australians define wealth itself. It is no longer just the family home and an investment portfolio.
Modern wealth includes businesses, digital assets, cryptocurrency, intellectual property, frequent flyer points and increasingly complex family arrangements.
At the same time, Australians are living longer than ever before, meaning wealth may need to support multiple generations simultaneously. This creates new responsibilities and new risks.
How do you help your children enter the property market without exposing family wealth to relationship breakdowns?
How do you structure wealth so that it remains a source of opportunity rather than future conflict?
These are the questions families should be asking now.
The recent debate surrounding testamentary trusts also serves as an important reminder that policy decisions can have unintended consequences for vulnerable Australians. It is encouraging that the government has listened to feedback and clarified its position.
But the lesson remains: the wealth landscape is changing.
Increasingly, governments, regulators and tax authorities are paying closer attention to how wealth is held and transferred. That means families cannot afford to adopt a “set-and-forget” approach to their structures.
The families who will be best placed for the future are not necessarily those with the greatest wealth.
They are the families with the greatest clarity. Clarity around ownership, succession and governance. And clarity around how wealth will transition from one generation to the next.
Ultimately, preserving wealth is not about avoiding change.
It is about preparing for it.
Because the greatest risk is not change itself.
It is losing the ability to respond to it.
Anthony Hunt is Co-Founder of Wealth Lawyers and former COO of Westpac Private Bank. He advises business owners, investors and affluent Australian families on wealth protection, succession planning and intergenerational wealth transfer

From snow-dusted valleys to festival-filled autumns, Bhutan reveals itself as a rare destination where culture, nature and spirituality unfold year-round.

A survey of people with at least $1 million in investable assets found women in their 30s and 40s look nothing like older generations in terms of assets and priorities