Why Prices of the World’s Most Expensive Handbags Keep Rising
Designers are charging more for their most recognisable bags to maintain the appearance of exclusivity as the industry balloons

 3 min
3 min
The price of a basic Hermès Birkin handbag has jumped $1,000. This first-world problem for fashionistas is a sign that luxury brands are playing harder to get with their most sought-after products.
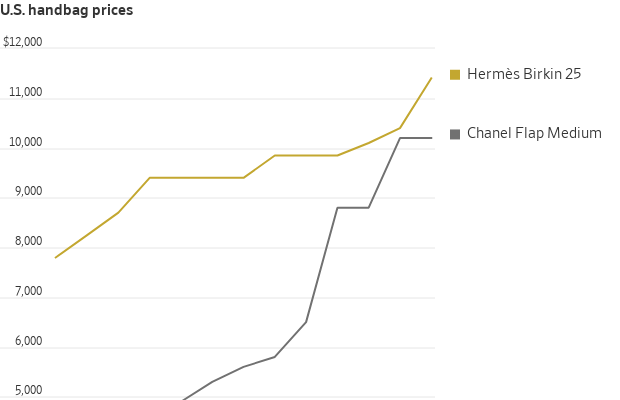
Hermès recently raised the cost of a basic Birkin 25-centimeter handbag in its U.S. stores by 10% to $11,400 before sales tax, according to data from luxury handbag forum PurseBop. Rarer Birkins made with exotic skins such as crocodile have jumped more than 20%. The Paris brand says it only increases prices to offset higher manufacturing costs, but this year’s increase is its largest in at least a decade.
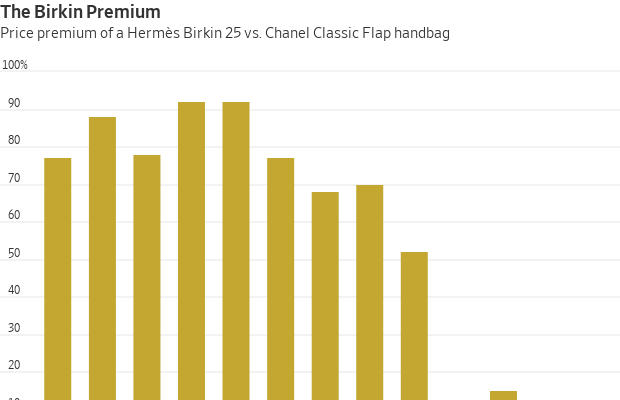
The brand may feel under pressure to defend its reputation as the maker of the world’s most expensive handbags. The “Birkin premium”—the price difference between the Hermès bag and its closest competitor , the Chanel Classic Flap in medium—shrank from 70% in 2019 to 2% last year, according to PurseBop founder Monika Arora. Privately owned Chanel has jacked up the price of its most popular handbag by 75% since before the pandemic.
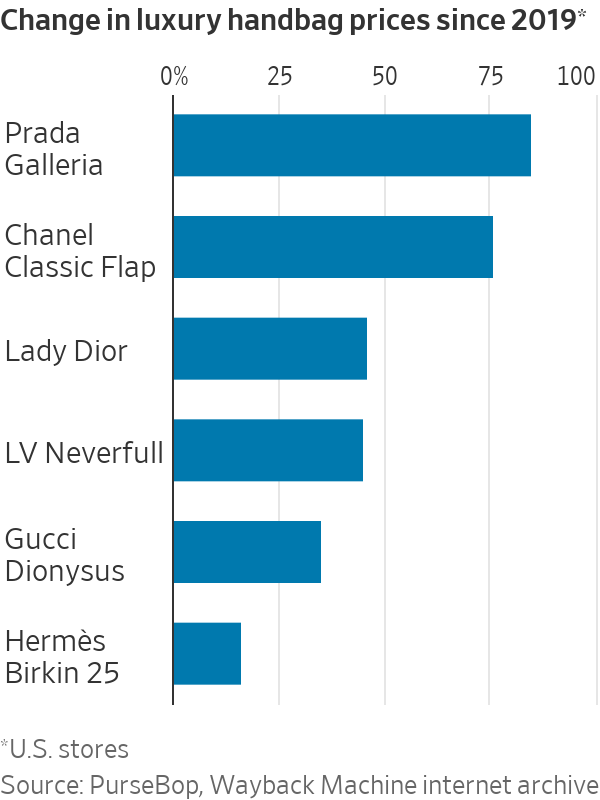
Eye-watering price increases on luxury brands’ benchmark products are a wider trend. Prada ’s Galleria bag will set shoppers back a cool $4,600—85% more than in 2019, according to the Wayback Machine internet archive. Christian Dior ’s Lady Dior bag and the Louis Vuitton Neverfull are both 45% more expensive, PurseBop data show.
With the U.S. consumer-price index up a fifth since 2019, luxury brands do need to offset higher wage and materials costs. But the inflation-beating increases are also a way to manage the challenge presented by their own success: how to maintain an aura of exclusivity at the same time as strong sales.
Luxury brands have grown enormously in recent years, helped by the Covid-19 lockdowns, when consumers had fewer outlets for spending. LVMH ’s fashion and leather goods division alone has almost doubled in size since 2019, with €42.2 billion in sales last year, equivalent to $45.8 billion at current exchange rates. Gucci, Chanel and Hermès all make more than $10 billion in sales a year. One way to avoid overexposure is to sell fewer items at much higher prices.
Many aspirational shoppers can no longer afford the handbags, but luxury brands can’t risk alienating them altogether. This may explain why labels such as Hermès and Prada have launched makeup lines and Gucci’s owner Kering is pushing deeper into eyewear. These cheaper categories can be a kind of consolation prize. They can also be sold in the tens of millions without saturating the market.
“Cosmetics are invisible—unless you catch someone applying lipstick and see the logo, you can’t tell the brand,” says Luca Solca, luxury analyst at Bernstein.
Most of the luxury industry’s growth in 2024 will come from price increases. Sales are expected to rise by 7% this year, according to Bernstein estimates, even as brands only sell 1% to 2% more stuff.
Limiting volume growth this way only works if a brand is so popular that shoppers won’t balk at climbing prices and defect to another label. Some companies may have pushed prices beyond what consumers think they are worth. Sales of Prada’s handbags rose a meagre 1% in its last quarter and the group’s cheaper sister label Miu Miu is growing faster.
Ramping up prices can invite unflattering comparisons. At more than $2,000, Burberry ’s small Lola bag is around 40% more expensive today than it was a few years ago. Luxury shoppers may decide that tried and tested styles such as Louis Vuitton’s Neverfull bag, which is now a little cheaper than the Burberry bag, are a better buy—especially as Louis Vuitton bags hold their value better in the resale market.
Aggressive price increases can also drive shoppers to secondhand websites. If a barely used Prada Galleria bag in excellent condition can be picked up for $1,500 on luxury resale website The Real Real, it is less appealing to pay three times that amount for the bag brand new.
The strategy won’t help everyone, but for the best luxury brands, stretching the price spectrum can keep the risks of growth in check.
 Copyright 2020, Dow Jones & Company, Inc. All Rights Reserved Worldwide. LEARN MORE


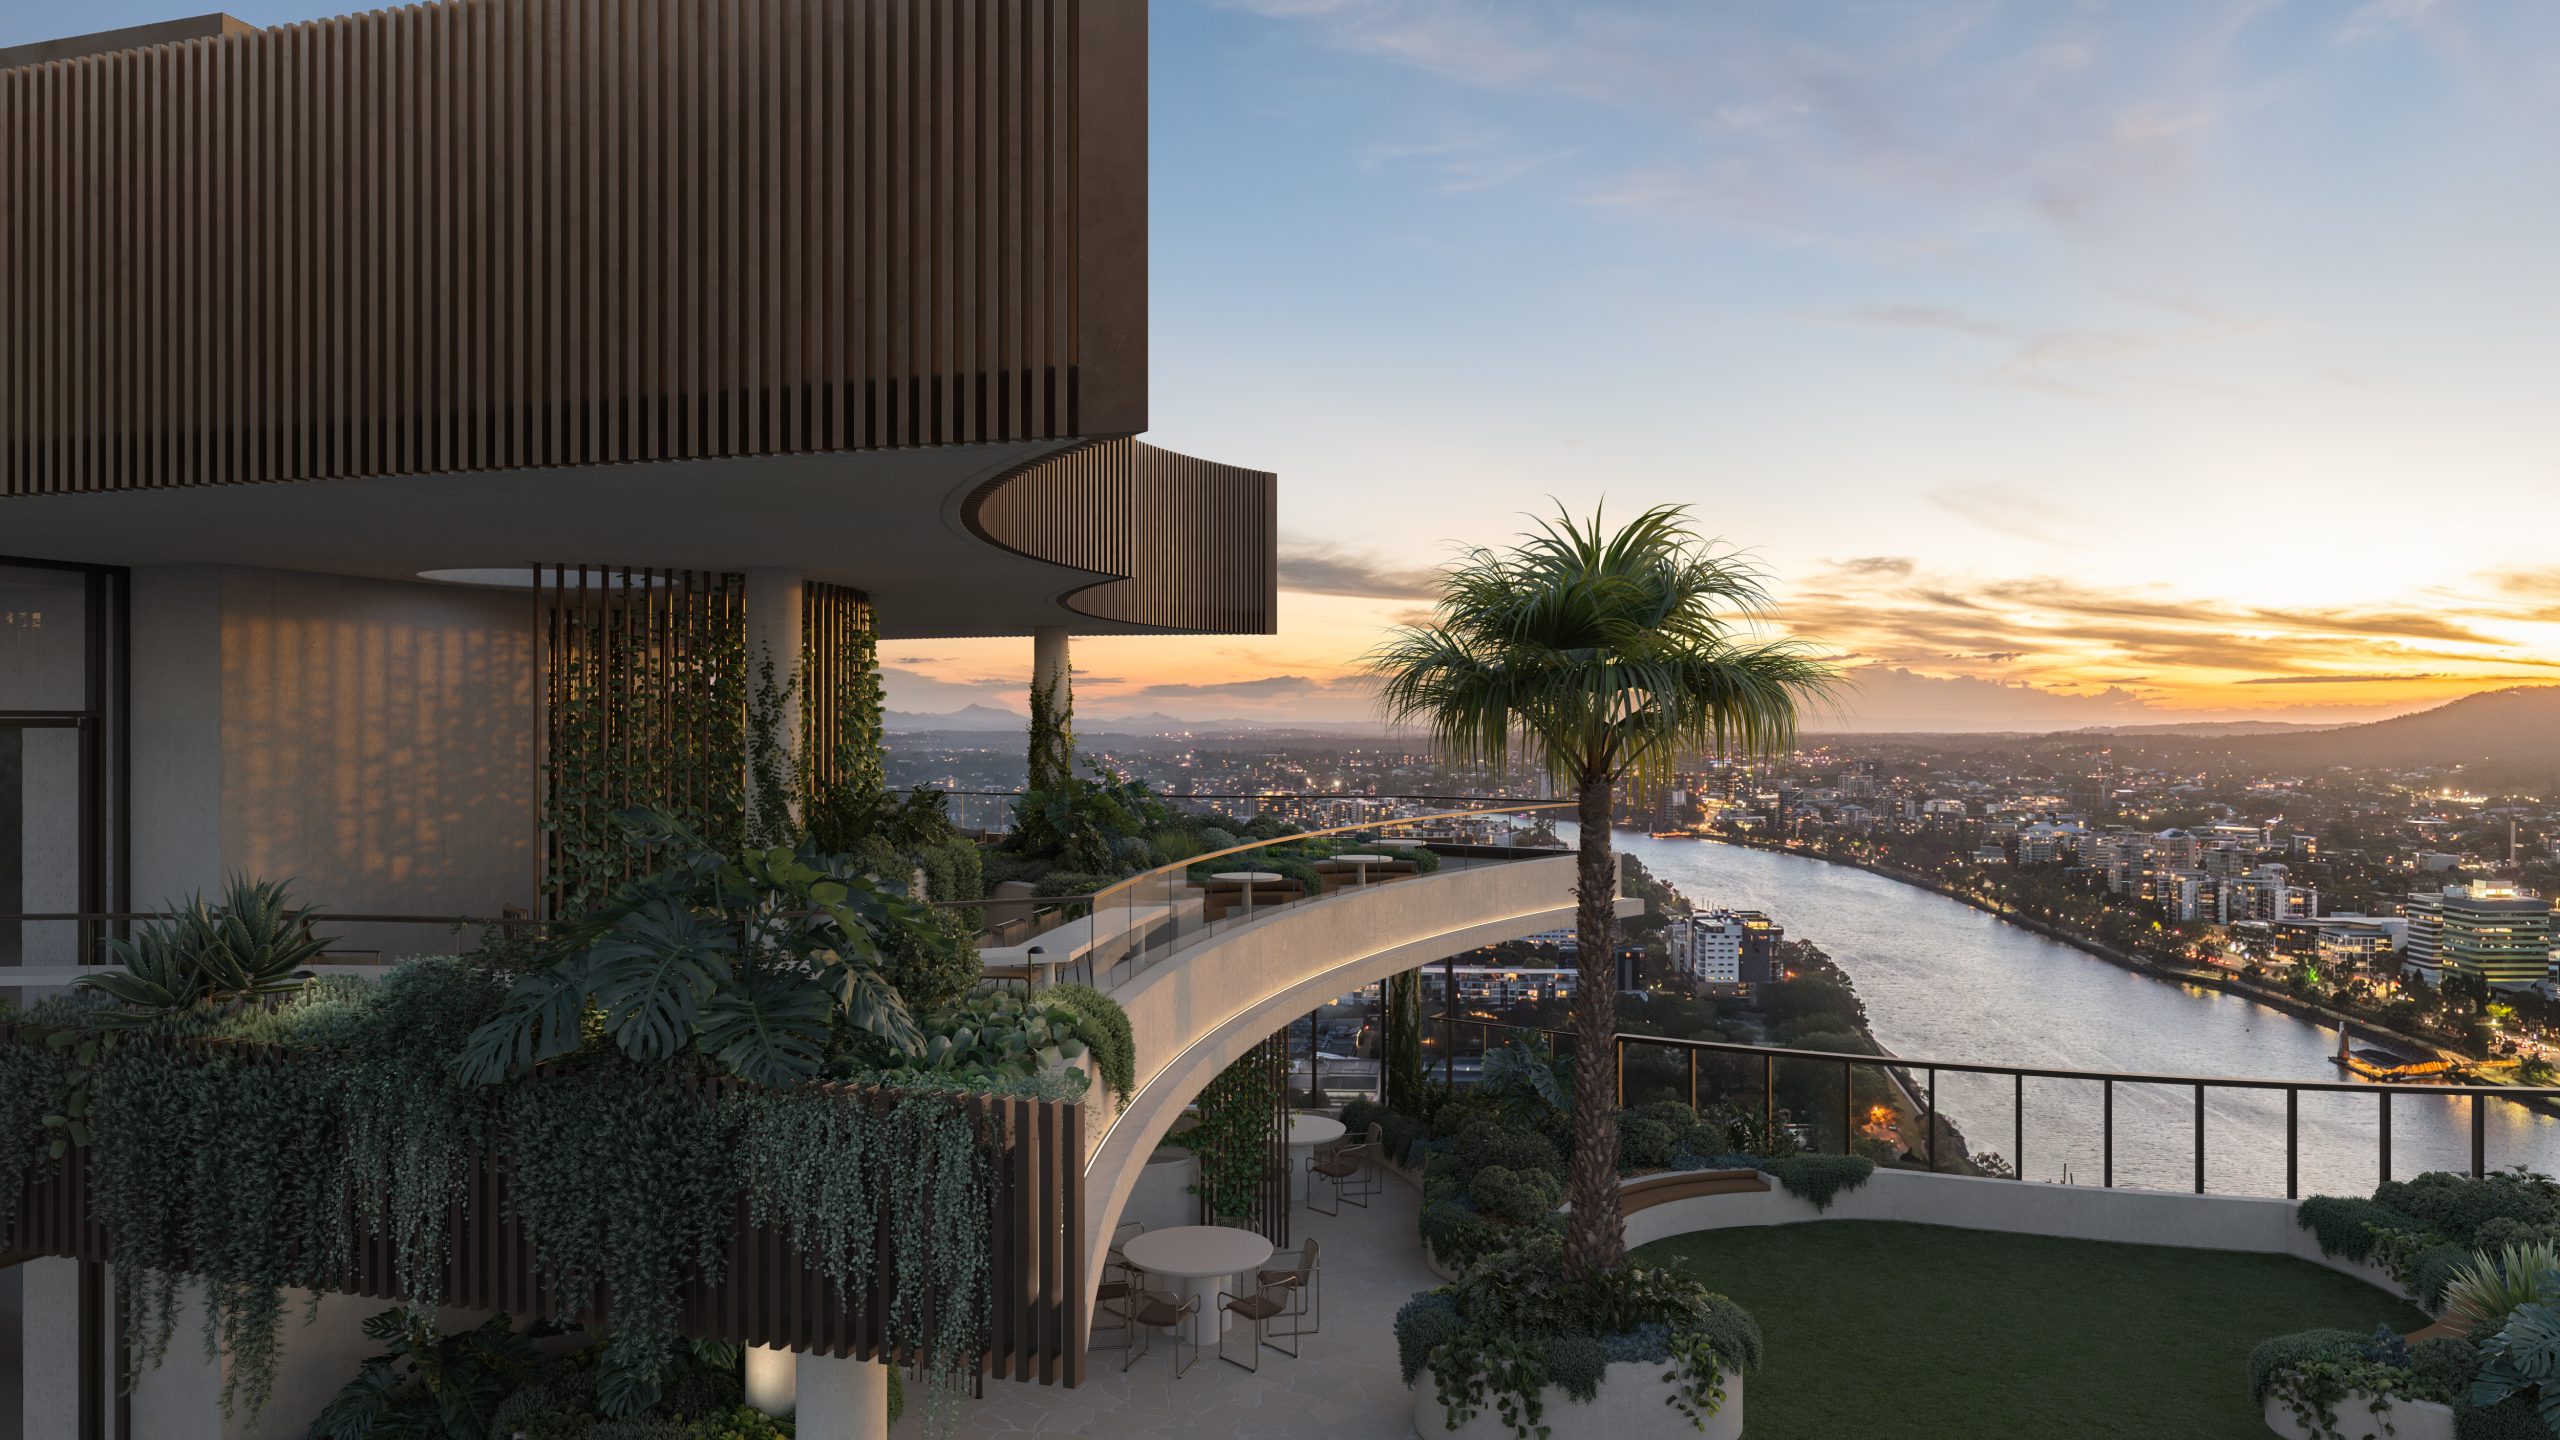
Set on one of the city’s last absolute riverfront sites, The Riversdale by Mosaic combines irreplaceable waterfront ownership with one of Brisbane’s most significant residential opportunities.
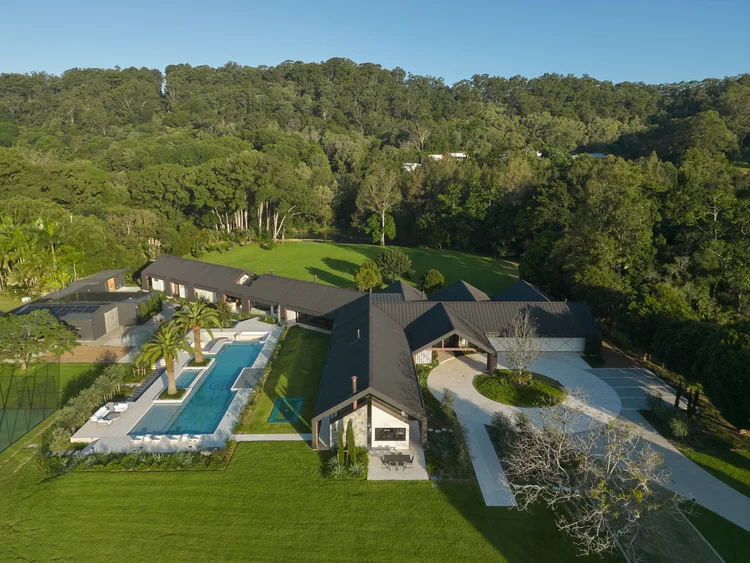
Margot Robbie may have travelled from a Queensland farm to the highest reaches of Hollywood, but a reported $28 million property deal suggests the Gold Coast has never lost its hold on her. The Australian actor and producer is believed to be the mystery buyer of Redwood, a seven-acre Currumbin Valley estate transformed into the …
Continue reading “Margot Robbie Reportedly Behind $28 Million Currumbin Valley Homecoming”
The federal budget has rattled property investors. But the biggest mistake isn’t the tax changes, it’s the conclusion many are drawing from them.
2 min
The recent budget has forced a reckoning for property investors.
Negative gearing now restricted to new residential builds, the CGT discount gone and on paper, the numbers look different.
And many investors are responding by pivoting toward yield, prioritising cash flow over capital growth in a way that property strategists say misses the point entirely.
“The debate has shifted to yield versus growth as if they are opposing forces,” says Abdullah Nouh, founder of Melbourne-based buyers’ agency Mecca Property Group. “But that framing is itself the mistake.”
Nouh, who works with high-net-worth families and investors on long-term acquisition strategy, argues that capital growth remains the primary driver of genuine wealth creation and that the post-budget environment has made quality assets more important, not less.
The numbers make his case plainly. An additional $500 per week in rental income is welcome. A prestige asset appreciating by $1 million over a market cycle is transformative.
These are not equivalent outcomes, and portfolios built around yield at the expense of location and land value tend to generate income while wealth stands largely still.
The more nuanced shift Nouh is seeing among sophisticated investors is a move toward assets where both outcomes can be engineered simultaneously – established homes on substantial land in quality locations, where the existing dwelling can be repositioned, rental returns improved, and the underlying land value compounds independent of what sits on it.
For investors with existing equity, commercial property is also entering the conversation in a more serious way.
Prestige industrial assets, medical centres and long-leased essential retail offer income profiles that residential property in most capital city markets cannot currently match: longer lease terms, tenants covering outgoings, and greater predictability than the residential tenancy cycle.
“The investors who build lasting wealth are rarely the ones who chased yield or growth exclusively,” says Nouh.
“They are the ones who built a strategy they could sustain – one that generated enough income to hold quality assets through multiple cycles while those assets compounded in value.”
The budget has changed the settings. It has not changed the fundamentals.

Chinese carmaker GAC will expand its Australian electric vehicle line-up with the city-focused AION UT hatchback.
Australia’s market is on the move again, and not always where you’d expect. We’ve found the surprise suburbs where prices are climbing fastest.