Inside Amazon’s Secret Operation to Gather Intel on Rivals
Staff went undercover on Walmart, eBay and other marketplaces as a third-party seller called ‘Big River.’ The mission: to scoop up information on pricing, logistics and other business practices.

 10 min
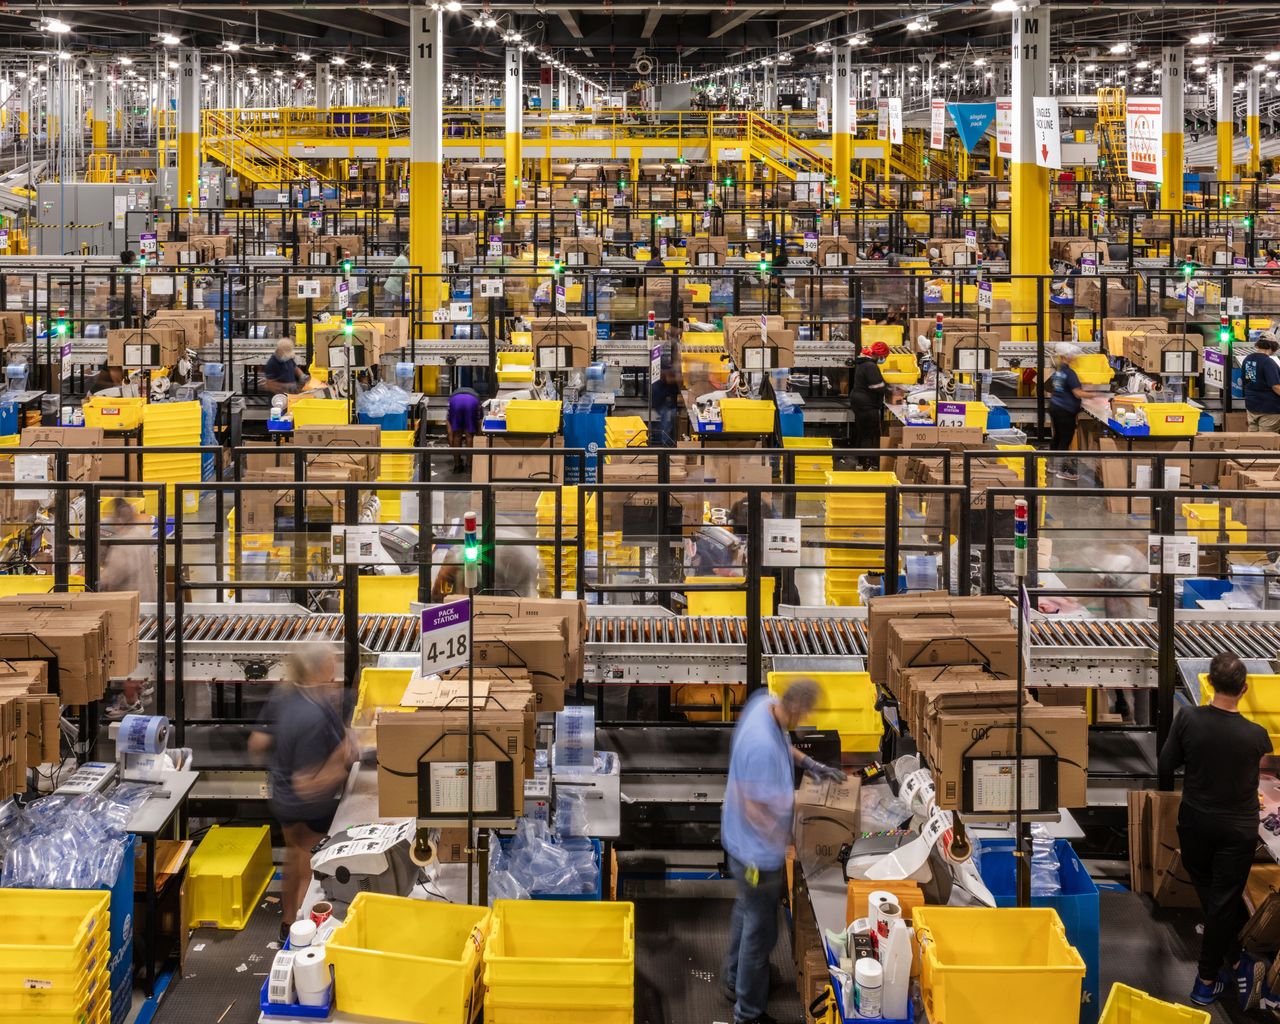
For nearly a decade, workers in a warehouse in Seattle’s Denny Triangle neighbourhood have shipped boxes of shoes, beach chairs, Marvel T-shirts and other items to online retail customers across the U.S.
The operation, called Big River Services International, sells around $1 million a year of goods through e-commerce marketplaces including eBay , Shopify , Walmart and Amazon .com under brand names such as Rapid Cascade and Svea Bliss. “We are entrepreneurs, thinkers, marketers and creators,” Big River says on its website. “We have a passion for customers and aren’t afraid to experiment.”
What the website doesn’t say is that Big River is an arm of Amazon that surreptitiously gathers intelligence on the tech giant’s competitors.
Born out of a 2015 plan code named “Project Curiosity,” Big River uses its sales across multiple countries to obtain pricing data, logistics information and other details about rival e-commerce marketplaces, logistics operations and payments services, according to people familiar with Big River and corporate documents viewed by The Wall Street Journal. The team then shared that information with Amazon to incorporate into decisions about its own business.
Amazon is the largest U.S. e-commerce company , accounting for nearly 40% of all online goods sold in the U.S., according to research firm eMarketer. It often says that it pays little attention to competitors , instead focusing all its energies on being “customer obsessed.” It is currently battling antitrust charges brought last year by the U.S. Federal Trade Commission and 17 states, which accused Amazon of a range of behaviour that harms sellers on its marketplace, including using anti-discounting measures that punished merchants for offering lower prices elsewhere.
The story of Big River offers new insight into Amazon’s elaborate efforts to stay ahead of rivals. Team members attended their rivals’ seller conferences and met with competitors identifying themselves only as employees of Big River Services, instead of disclosing that they worked for Amazon.
They were given non-Amazon email addresses to use externally—in emails with people at Amazon, they used Amazon email addresses—and took other extraordinary measures to keep the project secret. They disseminated their reports to Amazon executives using printed, numbered copies rather than email. Those who worked on the project weren’t even supposed to discuss the relationship internally with most teams at Amazon.
An internal crisis-management paper gave advice on what to say if discovered. The response to questions should be: “We make a variety of products available to customers through a number of subsidiaries and online channels.” In conversations, in the event of a leak they were told to focus on the group being formed to improve the seller experience on Amazon, and say that such research is normal, according to people familiar with the discussions.
Senior Amazon executives, including Doug Herrington , Amazon’s current CEO of Worldwide Amazon Stores, were regularly briefed on the Project Curiosity team’s work, according to one of the people familiar with Big River.
Some aspects were more Maxwell Smart than James Bond. The Big River website contains a glaring typo, and a so-called Japanese streetwear brand that the team concocted lists a Seattle address on its contacts page. Big River’s team members list Amazon as their employer on LinkedIn—potentially blowing their cover.
The LinkedIn page of Max Kless, a former eBay executive who led Big River in Germany before moving to a senior role on the team in the U.S., says that he “developed and led a research subsidiary for Amazon in Germany that prototyped and researched new experiences for Small Business sellers and developers.” Kless didn’t respond to requests for comment.
“Benchmarking is a common practice in business. Amazon, like many other retailers, has benchmarking and customer experience teams that conduct research into the experiences of customers, including our selling partners, in order to improve their experiences working with us,” an Amazon spokeswoman said. Amazon believes its rivals also carry out research on Amazon by selling on Amazon’s site, she said.
Focus on Walmart
Virtually all companies research their competitors, reading public documents for information, buying their products or shopping their stores. Lawyers say there is a difference between such corporate intelligence gathering of publicly available information, and what is known as corporate or industrial espionage.
Companies can get into legal trouble for actions such as hiring a rival’s former employee to obtain trade secrets or hacking a rival. Misrepresenting themselves to competitors to gain proprietary information can lead to suits on trade secret misappropriation, said Elizabeth Rowe, a professor at the University of Virginia School of Law who specialises in trade secret law.
Amazon for years has had what it calls a benchmarking team that sizes up rivals to ensure the best experience for people who shop on its site. The team has placed orders on websites such as Walmart.com for delivery around the U.S. to test things such as how long it takes competitors to ship. Other companies also have teams to compare themselves to rivals.
In late 2015, Amazon’s benchmarking team proposed a different sort of project. The business of hosting other merchants to sell their products on Amazon’s platform was becoming increasingly important. So-called third-party sellers on Amazon’s Marketplace, which the company started in 2000, surpassed half of the company’s total merchandise sales that year, and rival retailers had started similar marketplaces.
Amazon wanted to better understand and improve the experiences of those outside vendors. The team decided to create some brands to sell on Amazon to see what the pain points were for sellers—and to sell items on rival marketplaces to compare the experiences, according to the people familiar with the effort.
The benchmarking team pitched “Project Curiosity” to senior management and got the approval to buy inventory, use a shell company and find warehouses in the U.S., Germany, England, India and Japan so they could pose as sellers on competitors’ websites.
The benchmarking team reported into the chief financial officer, Brian Olsavsky , for years, but this year changed to report to Herrington, the consumer chief. Olsavsky and Herrington didn’t respond to requests for comment made through Amazon.
Once launched, the focus of the project quickly started shifting to gathering information about rivals, the people said.
In the U.S., the Big River team started by scooping up merchandise from Seattle retailers holding “going out of business” sales. Some of its first products were Saucony sneakers from a local retailer that was closing. The company registered for a licensing agreement with the popular Marvel superhero franchise to sell Marvel-branded items, and bought items including Tommy Bahama beach chairs from Costco to resell.
In the pitch, Project Curiosity leaders identified online marketplaces that they wanted to sell on, including Best Buy and Overstock.
The top goal was Walmart, Amazon’s biggest rival. But Walmart had a high bar for sellers on its marketplace, accepting only vendors who sold large volumes on other marketplaces first. Big River initially couldn’t qualify to be a Walmart Marketplace seller, but it did sell on Jet.com, which Walmart acquired in 2016 and later closed in 2020. And in India, it sold on Flipkart, the giant Indian e-commerce marketplace in which Walmart owned a majority stake.
In order to meet Walmart’s revenue threshold, the Big River team focused on pumping products through Amazon.com to bolster its overall revenue, some of the people said. Big River’s goal wasn’t to do massive amounts of volume on the competing platforms, but to simply get on them and gain access, they said.
The Amazon spokeswoman said that in 2023, 69% of Big River revenue worldwide was on Amazon.com.
In 2019, Big River finally got onto Walmart’s website. This month, Big River had around 15 products listed on Walmart.com under the seller name Atlantic Lot, including Tommy Bahama beach chairs, cooking woks and industrial-size food containers. In 2023, Big River had more than $125,000 in revenue on Walmart.com alone, according to a person familiar with the matter.
Walmart wasn’t aware that Amazon ran the seller accounts on the Walmart and Flipkart sites before the Journal told it, according to a person familiar with the matter.
Rivals’ logistics services
Atlantic Lot is listed as a “Pro Seller”—a distinction Walmart says is for “top-performing Walmart Marketplace sellers.” Listings show that Walmart Logistics, another Amazon rival, handles storage and shipping for it.
Amazon at the time also was building up its logistics business to store and ship items for sellers for a fee to compete with FedEx and United Parcel Service . The business has boomed over the past decade. Amazon’s total revenue from what it calls third-party seller services has grown nearly twelvefold since 2014 to $140 billion last year, accounting for nearly a quarter of Amazon’s total.
To get information about rival logistics services, the Big River team stored inventory with companies including FedEx. Other targets, according to an internal document, included UPS, DHL, Deliverr and German logistics company Linther Spedition.
FedEx in 2017 launched FedEx Fulfillment, a competitor to Fulfillment by Amazon, for offering logistics to sellers. Big River was accepted into the FedEx Fulfillment program as an early customer, and the team received early details about pricing, rate cards and other terms as a result of the partnership, according to the people. FedEx had several phone calls and email exchanges with Big River team members who represented themselves as Big River employees and didn’t disclose their employment at Amazon, according to some of the people.
The team presented its findings from being part of the FedEx program to senior Amazon logistics leaders. They used the code name “OnTime Inc.” to refer to FedEx. Amazon made changes to its Fulfillment by Amazon service to make it more competitive with FedEx’s new product as a result of the information it learned from the partnership, according to one of the people.
For such meetings, the team avoided distributing presentations electronically to Amazon executives. Instead, they printed the presentations and numbered the documents. Executives could look at the reports and take notes, but at the end of the meeting, team members collected the papers to ensure that they had all copies, the people said.

Amazon took other measures to hide the connection with Big River. Staffers were instructed to use their second, non-Amazon email address—which had the domain @bigriverintl.com—when emailing other platforms to avoid outing their Amazon employment.
“We were encouraged to work off the grid as much as possible,” said one of the former team members, about using the outside email.
Amazon’s internal lawyers reminded Big River team members not to disclose their connection to Amazon in their conversations with FedEx, according to an email viewed by the Journal.
Staffers, who worked in private areas of Amazon offices, were told not to discuss their work with other Amazon employees who weren’t cleared to know about the project. In the early days, some Big River team members had to take time away from their Amazon desk jobs to go to the warehouses to fulfill orders and pack them in boxes to send out.
When gaining access to rival seller systems, Big River members were instructed to take screenshots of competitor pricing, ad systems, cataloging and listing pages, according to the people. They weren’t allowed to email the screenshots to Amazon employees, but instead showed the screenshots to the Amazon employees on the Marketplace side of the business in person so they didn’t create a paper trail, some of the people said. Amazon then made changes it believed improved the seller experience on its site based on the information.
The Amazon spokeswoman said the team was secretive so that it wouldn’t get any special treatment as a seller on Amazon.com.
Still, there were telltales. Registration documents filed with the Washington Office of the Secretary of State for Big River Services, while not mentioning Amazon, list a management team made up of current and former Amazon employees, including lawyers. The management team lists its address as 410 Terry Ave. in Seattle, which is Amazon’s headquarters.
Corporate filings for Big River in the United Kingdom and other foreign countries also named officials who are senior Amazon employees and lawyers. In one U.K. disclosure, Amazon is named as owning more than 75% of the company.
Amazon officials felt confident that competitors wouldn’t look up filings to see who was behind the company, some of the people said.
A Las Vegas conference
Some team members were uncomfortable with the work they were doing, according to some of the people.
Among the anxiety-inducing activities was representing themselves as employees of Big River in person while attending conferences thrown by rivals. For instance, team members attended eBay’s Las Vegas conference for sellers, according to some of the people. EBay describes the event as a way for sellers to meet with eBay management and learn of planned big changes coming for sellers and “exclusive information.”
Benchmarking-team leadership ordered up what Amazon calls a PRFAQ that would outline what to do if competitors or the press discovered the project. In the event of a leak, leadership was to say that the group was formed to improve the seller experience on Amazon.com, and that Amazon pays attention to competition but doesn’t “obsess” over it. They were also told to act like this was normal business behavior in the event of a leak, according to one of the people.
In 2017, Amazon formally changed the name of Project Curiosity to the Small Business Insights team to make it sound less cryptic, some of the people said.
The Big River team invented its own brands to sell on the competing sites, including “Torque Challenge” and “Crimson Knot.”
Teams often changed the brand name once they sold out its inventory, creating new brands when they received new products.
In India, Amazon gained access to e-commerce giant Flipkart in March 2018 with the Crimson Knot brand, around the time rumors of a Walmart acquisition swirled in local media. Walmart bought a majority stake in Flipkart in May of that year.
Crimson Knot makes wooden home goods, with its website’s “About Us” page saying: “Based in a small wood workshop in Bangalore, our dedicated team of 8 skilled craftsmen work consistently to handcraft each piece from scratch, transforming them into stunning showstoppers.”
Crimson Knot still lists products on Flipkart and stores them with Flipkart’s logistics services.
The endeavour wasn’t designed to make money. In 2019, for instance, the Indian Big River team projected revenue of $165,000 while it expected costs of $463,000, according to an internal company document.
Each of the five countries operated a little differently to better test different programs. Globally, in total, Big River gained access to rival marketplaces including Alibaba, Etsy, Real.de, Wish and Rakuten, among many other platforms. In 2019, the team set a goal to get onto 13 additional new marketplaces, according to an internal company document.
The Amazon spokeswoman declined to comment on the number of rival websites Big River operates on.
The Japanese team went so far as to create a streetwear brand with its own website and custom-designed products. They called it Not So Ape, saying it was founded in Tokyo in 2017 and “inspired by the street style we see everyday.”
Not So Ape—which isn’t related to an upscale Japanese streetwear brand called A Bathing Ape—says on its website: “Our name stems from our belief that creative expression is what truly separates us from primates.” Not So Ape has Instagram and TikTok accounts, and its site continues to offer products such as $50 knit beanies and $95 hoodies.
Not So Ape is sold on Yahoo Japan’s marketplace, Zozotown, and uses rival payment services from Shopify, Google and Meta platforms. Its U.S. website is hosted by Shopify—which was the target of a previous effort by Amazon, code named “Project Santos,” to replicate parts of its business model, the Journal has reported.
Not So Ape’s English-language site’s terms of service says it is operated by Big River and lists a Seattle contact address of “2300 7th Ave, Ste B100, Back Entrance”—a building adjacent to a main Amazon campus.
 Copyright 2020, Dow Jones & Company, Inc. All Rights Reserved Worldwide. LEARN MORE


Ophora Tallawong has launched its final release of quality apartments priced under $700,000.

From bushland greens to valley reds, the country’s most awarded designers are proving that the best colour palette was never on a swatch card; it was outside the window all along.


The federal budget has rattled property investors. But the biggest mistake isn’t the tax changes, it’s the conclusion many are drawing from them.
2 min
The recent budget has forced a reckoning for property investors.
Negative gearing now restricted to new residential builds, the CGT discount gone and on paper, the numbers look different.
And many investors are responding by pivoting toward yield, prioritising cash flow over capital growth in a way that property strategists say misses the point entirely.
“The debate has shifted to yield versus growth as if they are opposing forces,” says Abdullah Nouh, founder of Melbourne-based buyers’ agency Mecca Property Group. “But that framing is itself the mistake.”
Nouh, who works with high-net-worth families and investors on long-term acquisition strategy, argues that capital growth remains the primary driver of genuine wealth creation and that the post-budget environment has made quality assets more important, not less.
The numbers make his case plainly. An additional $500 per week in rental income is welcome. A prestige asset appreciating by $1 million over a market cycle is transformative.
These are not equivalent outcomes, and portfolios built around yield at the expense of location and land value tend to generate income while wealth stands largely still.
The more nuanced shift Nouh is seeing among sophisticated investors is a move toward assets where both outcomes can be engineered simultaneously – established homes on substantial land in quality locations, where the existing dwelling can be repositioned, rental returns improved, and the underlying land value compounds independent of what sits on it.
For investors with existing equity, commercial property is also entering the conversation in a more serious way.
Prestige industrial assets, medical centres and long-leased essential retail offer income profiles that residential property in most capital city markets cannot currently match: longer lease terms, tenants covering outgoings, and greater predictability than the residential tenancy cycle.
“The investors who build lasting wealth are rarely the ones who chased yield or growth exclusively,” says Nouh.
“They are the ones who built a strategy they could sustain – one that generated enough income to hold quality assets through multiple cycles while those assets compounded in value.”
The budget has changed the settings. It has not changed the fundamentals.

From gorilla encounters in Uganda to a reimagined Okavango retreat, Abercrombie & Kent elevates its African journeys with two spectacular lodge transformations.

Two coming 2027 models – the first of the “Neue Klasse” cars coming to the U.S. early next year – have been revealed.