The U.S. and IMF Disagree About China. That’s a Problem.
The IMF doesn’t share U.S. view that China’s massive trade surpluses are hurting the world, and that tension is likely to grow

 4 min
4 min
Eighty years ago world leaders meeting in Bretton Woods, N.H., created the International Monetary Fund to prevent the sorts of economic imbalances that had brought on the Great Depression.
Today, imbalances once again threaten global harmony. China’s massive trade surplus is fuelling a backlash. The U.S. attributes those surpluses to China holding down consumption while subsidising manufacturing and exports, inflicting collateral damage on its trading partners. And it would like the IMF to say so.
The IMF, though, has steered a more neutral path. It has prodded Beijing to change its economic model while playing down any harm from that model for the world.
Decades ago, U.S. leaders thought bringing China into the postwar economic institutions such as the IMF and World Trade Organization would make Beijing more market-oriented and the world more stable. They now think the opposite. China has doubled down on an authoritarian, state-driven economic model that many in the West see as incompatible with their own.
The IMF, the world’s most influential international economic institution, may find itself torn between irreconcilable visions of the global economy, especially if former President Donald Trump is re-elected next month.
Trump has prioritised reducing the trade deficit, especially with China, through tariffs, an approach the IMF has criticised. Many of his advisers are deeply suspicious of both Beijing and international institutions. Project 2025, an agenda for a second Trump term that includes many Trump advisers as authors, has suggested the U.S. should leave the IMF, though there is no sign Trump agrees.
The U.S. has been upset about the growth in China’s trade surplus since it joined the World Trade Organization in 2001, wiping out U.S. factory jobs in what became known as the China shock .
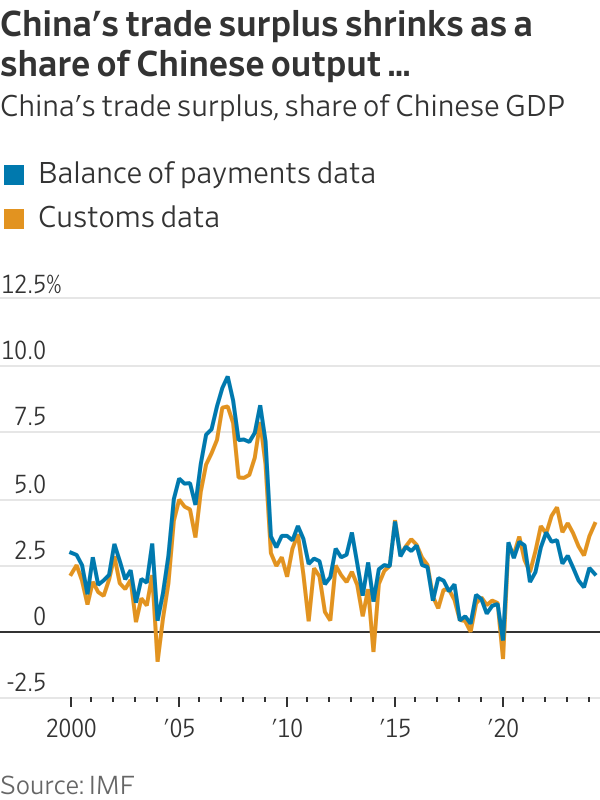
China’s surpluses have since shrunk as a share of its gross domestic product. But because China’s economy is now so large, that surplus has grown as share of world GDP, to 0.7%. Other countries are alarmed at a growing flood of cheap manufacturing imports, dubbed “China Shock 2.0 .”
Jake Sullivan , President Biden’s national security adviser, said at the Brookings Institution Wednesday that China “is producing far more than domestic demand, dumping excess onto global markets at artificially low prices, driving manufacturers around the world out of business, and creating a chokehold on supply chains.”
Treasury Undersecretary Jay Shambaugh told me at a panel organised by the Atlantic Council two weeks ago that China is “already 30% of global manufacturing. You can’t grow at a massive rate when you start from 30% of the world without displacing not just us, but lots of countries.”
Pointing out such tensions is part of the IMF’s job, Shambaugh said at the event. While the IMF has said China’s industrial policies may be hurting its trading partners, “I would like to see them pay more attention…to the aggregate external imbalance.”
The IMF’s architects believed a breakdown in economic cooperation contributed to the Depression. Countries such as the U.S. that ran large trade surpluses felt no pressure to help those with deficits, like Britain. Depressed countries sought to limit imports and boost exports by devaluing their currencies or imposing tariffs, in effect seeking to export their unemployment.
To end such “beggar-thy-neighbour” policies, British economist John Maynard Keynes proposed that trade be conducted through a global bank and currency that would prevent big deficits and surpluses. Instead, at Bretton Woods, delegates agreed to peg their currencies to the dollar with the IMF overseeing periodic revaluations.
By the 1970s, inflation and growing trade deficits caused fixed exchange rates to collapse. Cross-border capital flows soared, enabling poor countries to borrow from western banks and investors. When they defaulted, the IMF had a new mission: helping them restructure their debts, usually on the condition of strict budget austerity. IMF, a popular joke ran, stood for “It’s Mostly Fiscal.”
Even today, while the IMF does still monitor trade deficits and surpluses, it rarely attributes those to cross-border influences, focusing instead on fiscal and other domestic factors.
In a blog post last month, IMF staff investigated the U.S. deficit and Chinese surplus and found little connection.
The U.S. deficit reflected strong government and household spending, while China’s surplus resulted from slumping property markets and domestic confidence. They “are mostly homegrown,” they wrote. In an implicit rebuke to the U.S., they wrote, “Worries that China’s external surpluses result from industrial policies reflect an incomplete view.”
This benign view of Chinese surpluses has drawn criticism. Brad Setser , a former U.S. Treasury official now at the Council on Foreign Relations, said the IMF has relied on data that understates the surplus.
Setser also raps the IMF’s advice to Beijing to let interest rates and the exchange rate fall while tightening fiscal policy—that is, raising taxes or cutting spending. That, he said, will weaken imports, boost exports and thus widen the trade surplus.
“Their analysis is all about how bad the fiscal situation is, with no real analysis of the balance of payments position,” Setser said.
Pierre-Olivier Gourinchas , the IMF’s chief economist, disagreed. He noted the IMF has consistently urged China to boost household consumption such as by strengthening the social safety net and shifting more of the tax burden from the high-consuming poor to the high-saving rich. He also noted that the IMF has argued for fiscal stimulus now and consolidation later.
Does the IMF’s opinion make a difference? Most countries—the big ones especially—will never need to borrow from the IMF and can thus ignore its advice. The IMF has long urged the U.S. to rein in its budget deficit, noting this contributes to its trade deficit, and the U.S. has just as long ignored it.
And yet when the IMF speaks, it does so with an authority and credibility that no private analyst or individual country commands.
China’s approach to boosting exports is “killing jobs elsewhere, and that’s something the IMF should call out,” said Martin Mühleisen , a former senior IMF official now at The Atlantic Council. “China doesn’t want bad publicity from the IMF, in part because the criticism would resonate in many countries.”
 Copyright 2020, Dow Jones & Company, Inc. All Rights Reserved Worldwide. LEARN MORE





Borrowers cannot control the Reserve Bank, but they can control how exposed their household budget is to its next decision. The RBA meets on 29 September with inflation concerns still elevated and major-bank economists increasingly bringing forward their rate-rise calls. Fixed mortgage rates have also been moving, reducing the value of waiting for perfect certainty. …
Continue reading “What mortgage holders should do before the next RBA decision”

Australian shares finished higher on Tuesday, September 22, as a technology rally and lower oil prices outweighed weakness in energy companies and continued anxiety about domestic interest rates. The S&P/ASX 200 closed 25.9 points, or 0.30 per cent, higher at 8,757.8. The All Ordinaries gained 0.36 per cent to 8,951.0, while the All Technology index …
Continue reading “ASX Wrap: Technology lifts the ASX as falling oil relieves inflation pressure”

 2 min
2 minAustralian shares finished higher on Tuesday, September 22, as a technology rally and lower oil prices outweighed weakness in energy companies and continued anxiety about domestic interest rates.
The S&P/ASX 200 closed 25.9 points, or 0.30 per cent, higher at 8,757.8. The All Ordinaries gained 0.36 per cent to 8,951.0, while the All Technology index rose 1.71 per cent.
Information technology was the strongest major sector, up 2.67 per cent. Megaport gained 4.3 per cent, NextDC rose 3.8 per cent and Life360 added 2.9 per cent, according to the ABC’s closing market report. The move followed a record Nasdaq close and reflected renewed demand for growth assets as oil prices eased.
Consumer discretionary gained 1.29 per cent, while real estate and healthcare each rose 0.76 per cent. The simultaneous strength of technology, discretionary shares and listed property was consistent with a modest easing in market inflation anxiety, although it did not erase expectations of a possible RBA increase at the 29 September meeting.
Energy was the clear laggard, down 1.16 per cent, after Brent crude briefly fell below US$100 a barrel overnight. Origin Energy dropped about 4 per cent, Woodside lost 2.4 per cent and AGL declined 2.3 per cent. Utilities were the weakest sector overall, down 2.03 per cent.
Among larger and liquid movers, Telix Pharmaceuticals rebounded 6.85 per cent after the previous session’s sharp acquisition-related decline. IDP Education jumped 20.67 per cent and was the largest percentage gainer in the ASX 300 screen, while Catalyst Metals fell 14.37 per cent. Those moves should be checked against company announcements before publication; percentage rankings alone do not establish cause or index impact.
Mining performance was mixed. Sunrise Energy Metals rose 12.71 per cent, FireFly Metals added 5.7 per cent and Bellevue Gold gained 4.8 per cent, while Resolute Mining lost 4.44 per cent.
The Australian dollar traded near US71.18 cents late in the session. Oil remained volatile as markets assessed potential US–Iran talks, making energy prices a continuing input into inflation expectations, bond yields and the RBA outlook.
For Wednesday, investors will watch oil, offshore technology leads, Australian bond yields and any new evidence that changes the probability of a September rate rise.
Market dashboard
S&P/ASX 200: 8,757.8, up 25.9 points or 0.30 per cent.
All Ordinaries: 8,951.0, up 0.36 per cent.
Best sector: Information Technology, up 2.67 per cent.
Weakest sector: Utilities, down 2.03 per cent. Energy fell 1.16 per cent.
Material winner: Telix Pharmaceuticals, up 6.85 per cent. Megaport rose 4.3 per cent and NextDC rose 3.8 per cent.
Material loser: Origin Energy, down about 4 per cent. Woodside fell 2.4 per cent.
ASX 300 percentage leader: IDP Education, up 20.67 per cent. Confirm announcement context before publication.
ASX 300 percentage laggard: Catalyst Metals, down 14.37 per cent. Confirm announcement context before publication.
AUD/USD: Approximately US$0.7118 late in the session.
Next catalyst: RBA policy decision on 29 September, oil-price volatility and offshore technology trading.

From Italian vegetable-tanned leather to real-world training insight, Australian brand PK9 Gear is redefining what luxury means for discerning dog owners.

From the shacks of yesterday to the sculptural sanctuaries of today, Australia’s coastal architecture has matured into a global benchmark for design.