What We Know About America’s Billionaires: 1,135 and Counting
Exclusive, up-close look at the richest people in the U.S., from celebrities like Taylor Swift and Elon Musk to a founder of a roofing supplier in Wisconsin

 3 min
3 min
“Billionaire” evokes tech founders such as Jeff Bezos or Bill Gates , but there is a large and growing group of people worth at least $1 billion in small towns and big cities that rarely make the headlines.
There were 1,135 billionaires in the U.S. as of 2024—up from 927 in 2020, according to data from Altrata, a wealth-intelligence firm. The biggest concentration, 255 of them, is in California. But the super rich are also behind businesses in places such as Ridgeland, Miss., and Waunakee, Wisc.
Collectively, these people are worth about $5.7 trillion, according to Altrata’s estimates. That’s enough wealth to buy…
While many of these individuals own properties in upscale communities such as Palm Beach, Fla., they also congregate in destinations such as Cashiers, N.C.—a town in the Blue Ridge Mountains where four billionaire families have residences. The smallest town where a billionaire owns property? Winifred, Mont., population 172.
The list of billionaires includes some familiar dynasties, such as the Walmart Waltons and Hyatt Pritzkers. There are also lesser known members of this elite club, such as Diane Hendricks , co-founder of roofing-products distributor ABC Supply, and the heirs to the Russell Stover Chocolates fortune.
The billionaire border can be fuzzy. Markets fluctuate, the value of private companies can be uncertain and big donations dent fortunes, meaning dozens of individuals—even stars such as LeBron James and Beyoncé—can move on or off the list.
The 100 richest billionaires account for nearly $3.86 trillion in wealth—more than half the total. Just three men— Elon Musk , Bezos and Mark Zuckerberg —account for almost $1 trillion of it.
Despite those outsize Silicon Valley fortunes , most U.S.-based billionaires didn’t make their wealth in tech. About 300 came from banking and finance, compared with roughly 110 from the tech sector. Another 75 came from real estate.
A third of billionaires inherited much or all of their wealth, Altrata said. There is just one Rockefeller on the list, but 50 billionaire heirs of five companies hold roughly $830 billion total. These individuals account for nearly 15% of all the billionaires’ wealth. undefined
Billionaires have publicly donated or pledged to give about $185 billion since 2015, according to Altrata. Mostly, they support causes such as education and medical research—they gave $90 billion to those two in the past 10 years. That has given them sway in ongoing campus debates over freedom of speech and antisemitism.
While some billionaires such as Gates and Warren Buffett have openly pledged to give away much of their wealth , others have donated little so far. About a quarter of the billionaires in the list have known donations of less than $1 million in the past decade.
Some give more to organizations they’re tied to. Hedge-fund manager Bill Ackman gave about $120 million to multiple causes, but he gave $1.36 billion to a foundation where he and his wife serve as trustees, which supports medical research and other causes.
Among the top recipients of donations tracked by Altrata are global charities such as the Gates Foundation and Gavi, the Vaccine Alliance.
One of the most popular recipients is the Central Park Conservancy in New York, which received donations from 89 billionaires worth about $100 million.
Johns Hopkins University received $7.5 billion from close to 30 billionaires, but most of it came from Michael Bloomberg , who gave more than $5 billion.
Methodology
The Wall Street Journal analysed data on more than 1,100 individuals provided by Altrata, which estimates net worth by assessing privately and publicly held businesses and investible assets. Altrata’s data on properties includes residences, land parcels and other properties owned in the person’s name. It uses primary business address to determine a billionaire’s location and assigns each billionaire to a primary industry based on their current roles. Altrata adjusts totals to account for shifts in asset values that could push some individuals over or under $1 billion in wealth.
 Copyright 2020, Dow Jones & Company, Inc. All Rights Reserved Worldwide. LEARN MORE


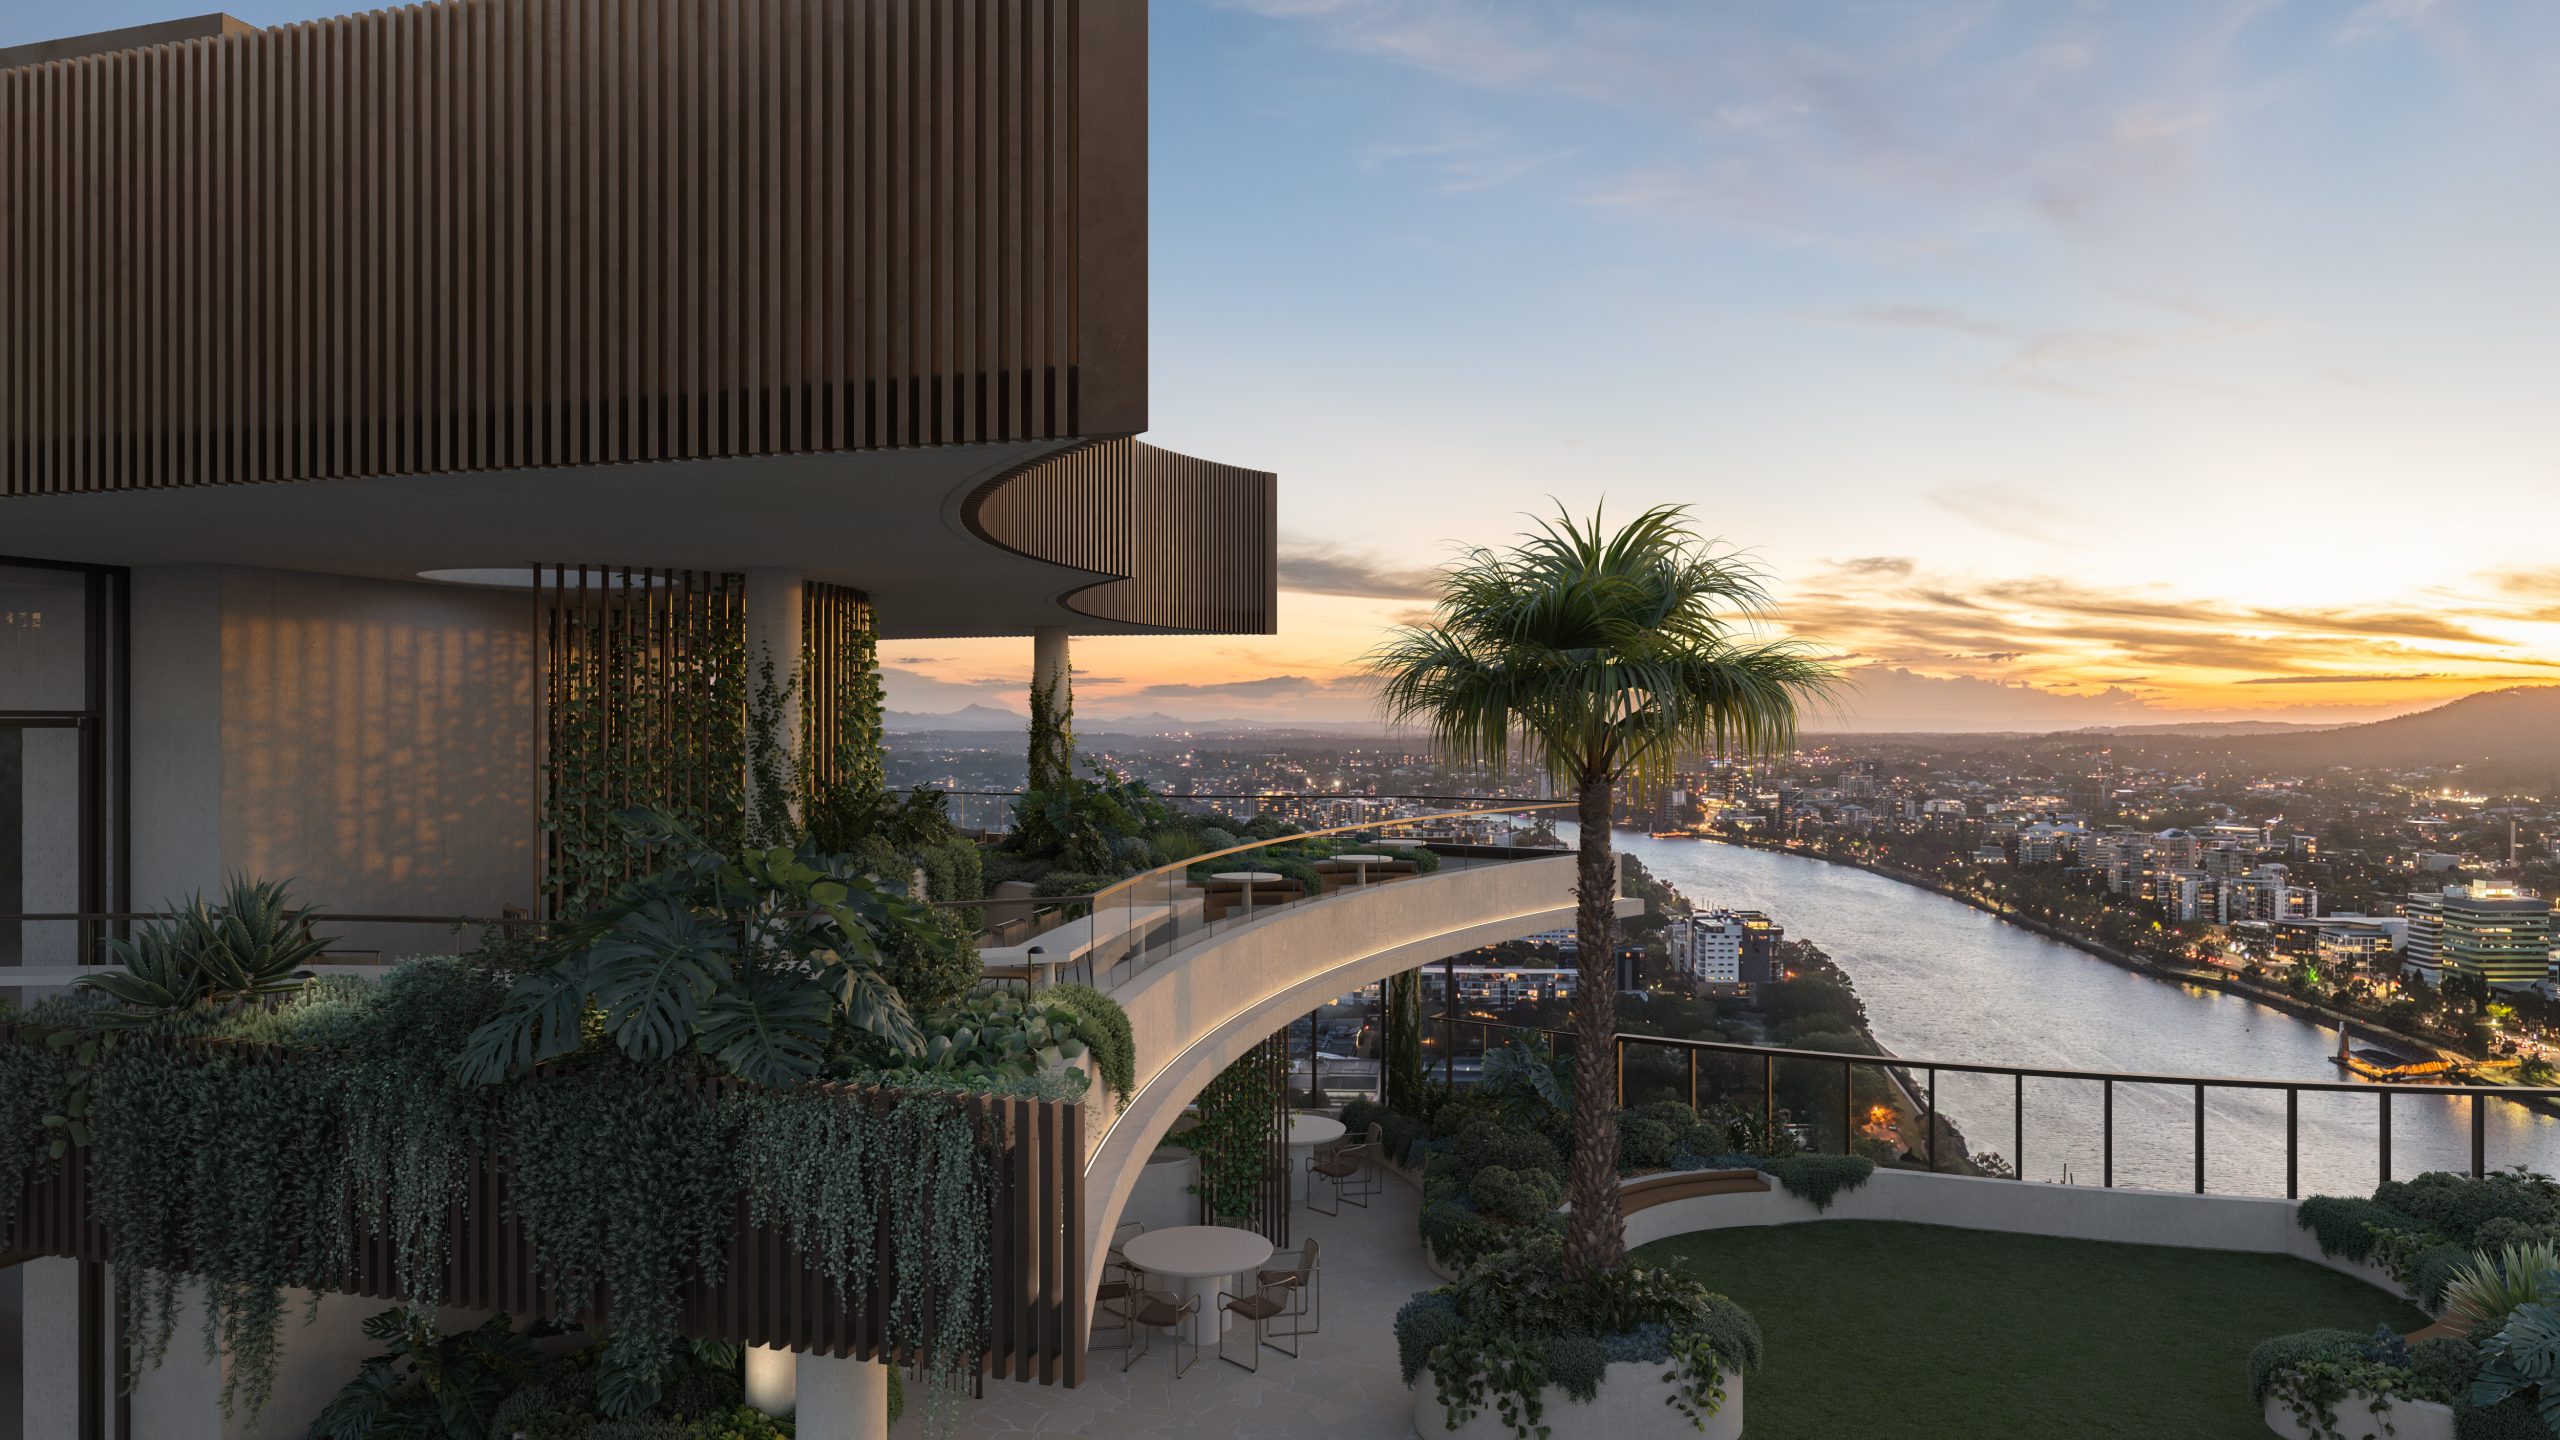
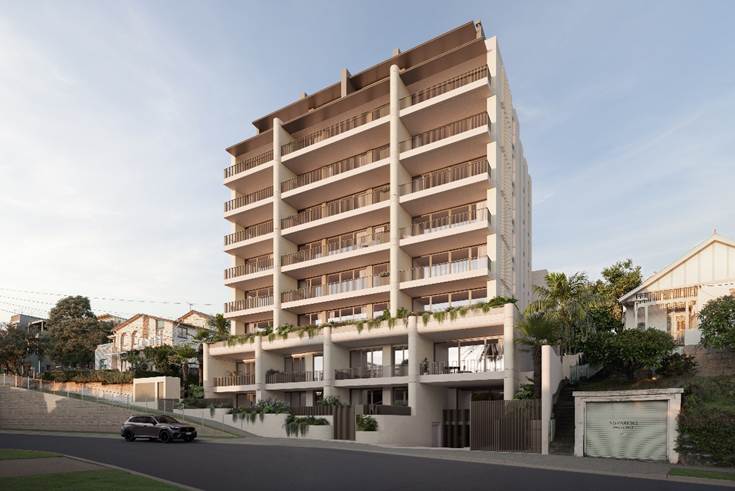
Set on one of the city’s last absolute riverfront sites, The Riversdale by Mosaic combines irreplaceable waterfront ownership with one of Brisbane’s most significant residential opportunities.
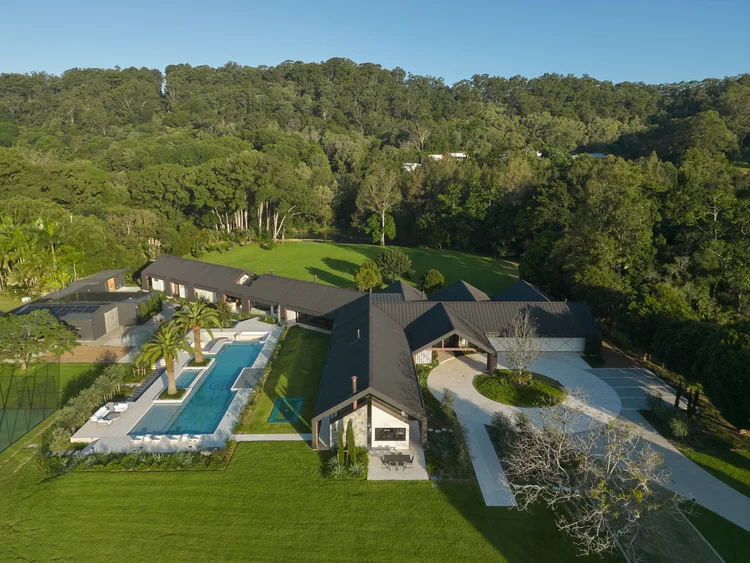
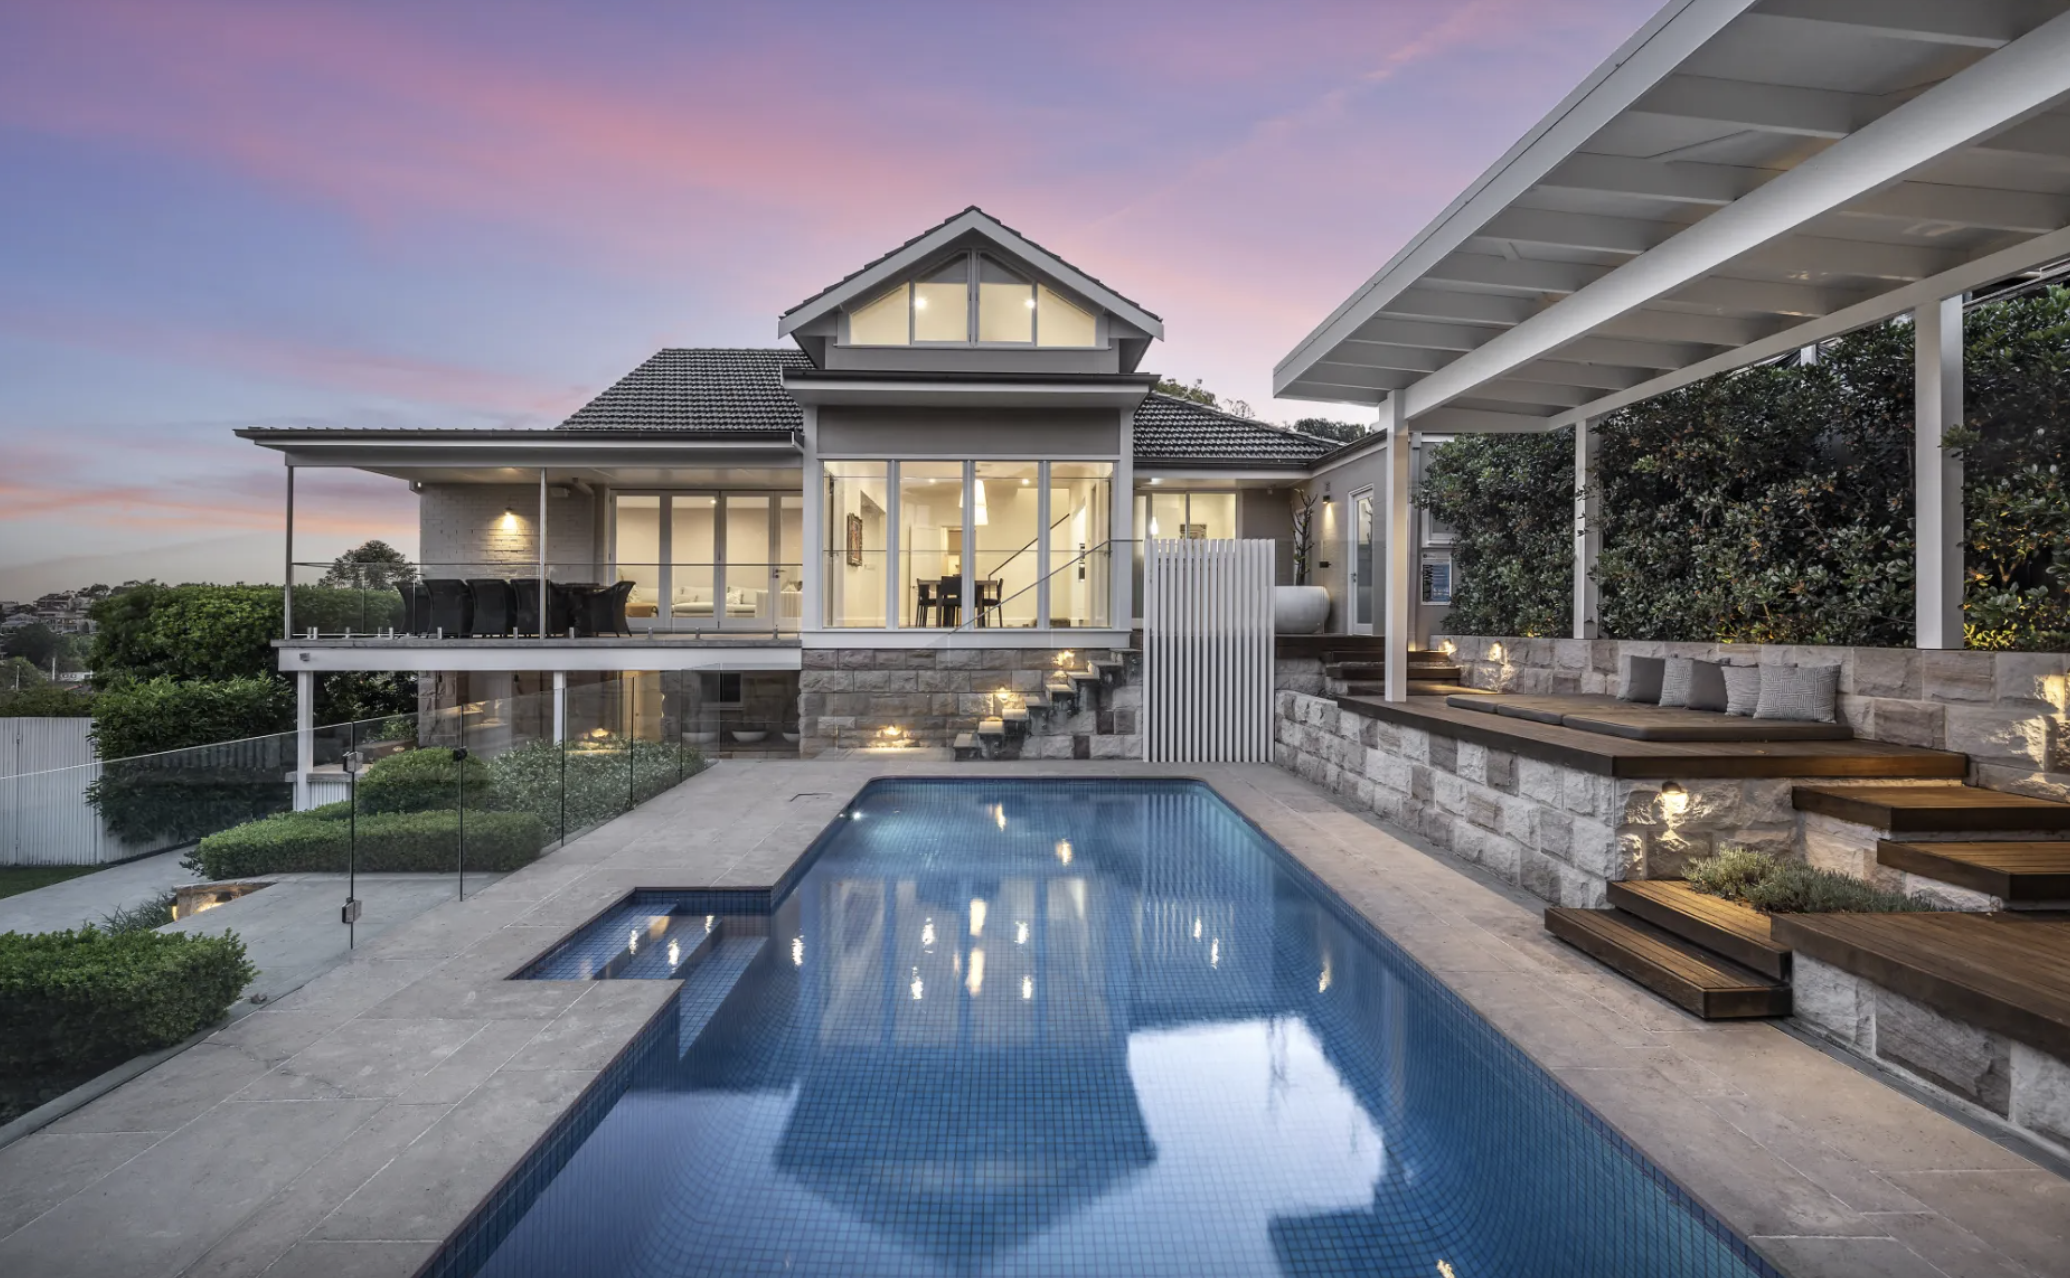
Margot Robbie may have travelled from a Queensland farm to the highest reaches of Hollywood, but a reported $28 million property deal suggests the Gold Coast has never lost its hold on her. The Australian actor and producer is believed to be the mystery buyer of Redwood, a seven-acre Currumbin Valley estate transformed into the …
Continue reading “Margot Robbie Reportedly Behind $28 Million Currumbin Valley Homecoming”


The federal budget has rattled property investors. But the biggest mistake isn’t the tax changes, it’s the conclusion many are drawing from them.
2 min
The recent budget has forced a reckoning for property investors.
Negative gearing now restricted to new residential builds, the CGT discount gone and on paper, the numbers look different.
And many investors are responding by pivoting toward yield, prioritising cash flow over capital growth in a way that property strategists say misses the point entirely.
“The debate has shifted to yield versus growth as if they are opposing forces,” says Abdullah Nouh, founder of Melbourne-based buyers’ agency Mecca Property Group. “But that framing is itself the mistake.”
Nouh, who works with high-net-worth families and investors on long-term acquisition strategy, argues that capital growth remains the primary driver of genuine wealth creation and that the post-budget environment has made quality assets more important, not less.
The numbers make his case plainly. An additional $500 per week in rental income is welcome. A prestige asset appreciating by $1 million over a market cycle is transformative.
These are not equivalent outcomes, and portfolios built around yield at the expense of location and land value tend to generate income while wealth stands largely still.
The more nuanced shift Nouh is seeing among sophisticated investors is a move toward assets where both outcomes can be engineered simultaneously – established homes on substantial land in quality locations, where the existing dwelling can be repositioned, rental returns improved, and the underlying land value compounds independent of what sits on it.
For investors with existing equity, commercial property is also entering the conversation in a more serious way.
Prestige industrial assets, medical centres and long-leased essential retail offer income profiles that residential property in most capital city markets cannot currently match: longer lease terms, tenants covering outgoings, and greater predictability than the residential tenancy cycle.
“The investors who build lasting wealth are rarely the ones who chased yield or growth exclusively,” says Nouh.
“They are the ones who built a strategy they could sustain – one that generated enough income to hold quality assets through multiple cycles while those assets compounded in value.”
The budget has changed the settings. It has not changed the fundamentals.
Margot Robbie may have travelled from a Queensland farm to the highest reaches of Hollywood, but a reported $28 million property deal suggests the Gold Coast has never lost its hold on her. The Australian actor and producer is believed to be the mystery buyer of Redwood, a seven-acre Currumbin Valley estate transformed into the …
Continue reading “Margot Robbie Reportedly Behind $28 Million Currumbin Valley Homecoming”

Automobili Lamborghini and Babolat have expanded their collaboration with five new colourways for the ultra-exclusive BL.001 racket, limited to just 50 pieces worldwide.