


Gold as an Inflation Hedge: What the Past 50 Years Teaches Us
And what the future of gold looks like.

 3 min
3 min
On a Sunday evening 50 years ago—on Aug. 15, 1971, to be exact—then-President Nixon interrupted “Bonanza,” one of the most popular TV shows of that era, to announce that he was ending the convertibility of the U.S. dollar into gold. Many consider it to be one of the most consequential decisions he made.
Up until this “closing of the gold window,” foreign central banks had been able to convert U.S. dollars into gold bullion at the fixed price of $35 an ounce. In theory, this had imposed a strict monetary discipline on the Federal Reserve, since inflating the money supply could have caused a run on Fort Knox, where the U.S. stored its supply of gold. And inflation did indeed jump in the years following Nixon’s decision to remove that restraint. So did the price of gold, which today is 50 times as high as it was that day.
This apparent correlation between gold and inflation has led many to believe that gold is a good inflation hedge. This belief isn’t supported by the data, however. If gold were a good and consistent hedge, the ratio of its price to the consumer-price index would have been relatively steady over the years. But that hasn’t been the case, as you can see from the accompanying chart: Over the past 50 years, the ratio has fluctuated from a low of 1.0 to a high of 8.4.
Gold is only a good inflation hedge over time frames far longer than any of our investment horizons, according to research conducted by Duke University professor Campbell Harvey and Claude Erb, a former commodities portfolio manager at TCW Group. They found that it’s only when measured over very long periods—a century or more—that gold has done a relatively good job maintaining its purchasing power. Over shorter periods its real, or inflation-adjusted, price fluctuates no less than that of any other asset.
Gold’s weakness as an inflation hedge may be even more pronounced today, Prof. Harvey says, because “gold is currently very expensive compared to its history.” The current gold-to-CPI ratio stands at 6.7, for example, nearly double its 50-year average of 3.6.
Light metal
Even though the price of gold is 50 times as high as in 1971, stocks have performed even better. The S&P 500 has produced an annualized return of 11.2% since August 1971, assuming dividends were reinvested along the way. That compares with 8.2% annualized for gold.
Furthermore, the only reason gold came even this close to matching stocks over the past 50 years was its huge return during the first decade following Nixon’s announcement. Take away that decade, and gold has lagged behind even intermediate-term Treasury notes. Over the past 40 years, gold has risen at a 3.6% annualized rate, compared with 12.2% for the S&P 500 and 8.2% for the Treasurys.
This doesn’t mean gold has no role to play in a diversified portfolio, however, even assuming the future will be like the past. Because the correlation of its returns with those of either equities or bonds has often been low or even negative, its presence in a portfolio can reduce volatility. Over the past 50 years, a stock-and-bond portfolio could have improved its risk-adjusted performance by adding a small allocation to gold—around 5% or so.
Still, even gold’s volatility-reducing potential isn’t guaranteed, since gold’s correlation with stocks has varied widely over the years. In fact, there have been occasions in which gold’s correlation to the stock market has been positive, which is just the opposite of what it should be to reduce a portfolio’s risk. One such recent occasion came during the stock market’s waterfall decline in February and March last year: Stocks of gold-mining shares dropped 39%, as measured by VanEck Vectors Gold Miners ETF (GDX)—even more than the 34% drop in the S&P 500. “What kind of safe haven is that?” Prof. Harvey asks.
The next 50 years
Gold’s inconsistent correlation with both stocks and inflation makes it difficult to project how it will perform over the next 50 years. An additional wild card, according to Prof. Harvey, is that gold now faces “competition it’s never had before” because of the advent of cryptocurrencies.
It is always possible that gold will be a more consistent inflation hedge in coming years. It’s just that you will have to look elsewhere than history to find support for such a possibility. Mr. Erb is cynical whether this will pose much of an obstacle to gold’s true believers, however: “The past can always be brushed aside when dreaming about how gold and inflation might move in tandem in the future.”
 Copyright 2020, Dow Jones & Company, Inc. All Rights Reserved Worldwide. LEARN MORE


This stylish family home combines a classic palette and finishes with a flexible floorplan

Just 55 minutes from Sydney, make this your creative getaway located in the majestic Hawkesbury region.


New research suggests spending 40 percent of household income on loan repayments is the new normal
3 min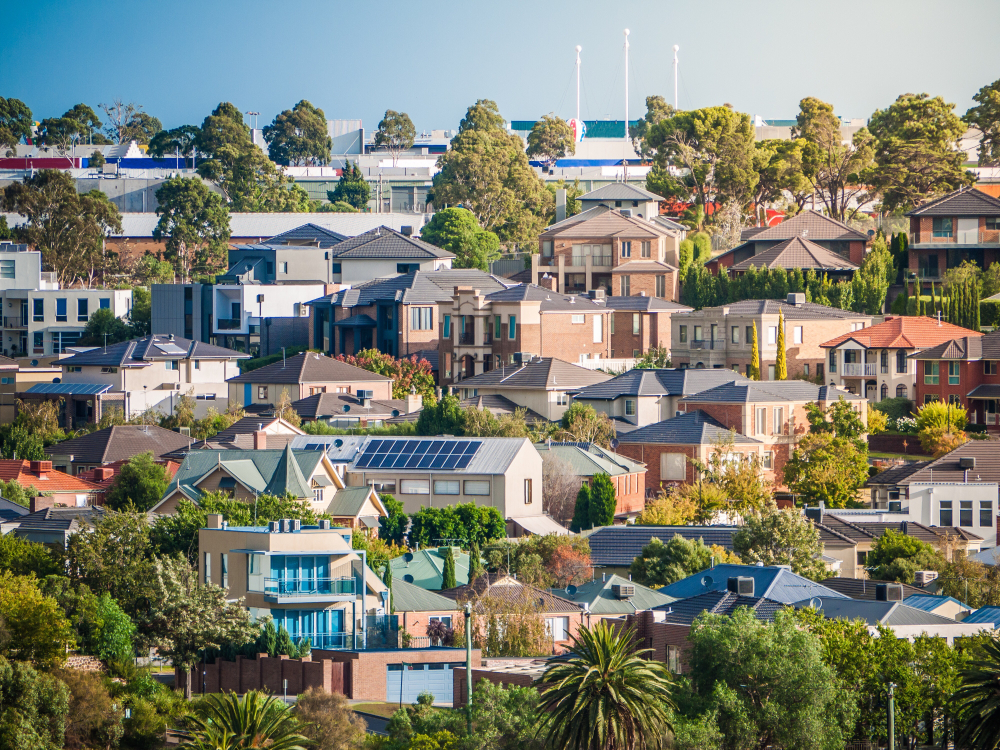
Requiring more than 30 percent of household income to service a home loan has long been considered the benchmark for ‘housing stress’. Yet research shows it is becoming the new normal. The 2024 ANZ CoreLogic Housing Affordability Report reveals home loans on only 17 percent of homes are ‘serviceable’ if serviceability is limited to 30 percent of the median national household income.
Based on 40 percent of household income, just 37 percent of properties would be serviceable on a mortgage covering 80 percent of the purchase price. ANZ CoreLogic suggest 40 may be the new 30 when it comes to home loan serviceability. “Looking ahead, there is little prospect for the mortgage serviceability indicator to move back into the 30 percent range any time soon,” says the report.
“This is because the cash rate is not expected to be cut until late 2024, and home values have continued to rise, even amid relatively high interest rate settings.” ANZ CoreLogic estimate that home loan rates would have to fall to about 4.7 percent to bring serviceability under 40 percent.
CoreLogic has broken down the actual household income required to service a home loan on a 6.27 percent interest rate for an 80 percent loan based on current median house and unit values in each capital city. As expected, affordability is worst in the most expensive property market, Sydney.
Sydney
Sydney’s median house price is $1,414,229 and the median unit price is $839,344.
Based on 40 percent serviceability, households need a total income of $211,456 to afford a home loan for a house and $125,499 for a unit. The city’s actual median household income is $120,554.
Melbourne
Melbourne’s median house price is $935,049 and the median apartment price is $612,906.
Based on 40 percent serviceability, households need a total income of $139,809 to afford a home loan for a house and $91,642 for a unit. The city’s actual median household income is $110,324.
Brisbane
Brisbane’s median house price is $909,988 and the median unit price is $587,793.
Based on 40 percent serviceability, households need a total income of $136,062 to afford a home loan for a house and $87,887 for a unit. The city’s actual median household income is $107,243.
Adelaide
Adelaide’s median house price is $785,971 and the median apartment price is $504,799.
Based on 40 percent serviceability, households need a total income of $117,519 to afford a home loan for a house and $75,478 for a unit. The city’s actual median household income is $89,806.
Perth
Perth’s median house price is $735,276 and the median unit price is $495,360.
Based on 40 percent serviceability, households need a total income of $109,939 to afford a home loan for a house and $74,066 for a unit. The city’s actual median household income is $108,057.
Hobart
Hobart’s median house price is $692,951 and the median apartment price is $522,258.
Based on 40 percent serviceability, households need a total income of $103,610 to afford a home loan for a house and $78,088 for a unit. The city’s actual median household income is $89,515.
Darwin
Darwin’s median house price is $573,498 and the median unit price is $367,716.
Based on 40 percent serviceability, households need a total income of $85,750 to afford a home loan for a house and $54,981 for a unit. The city’s actual median household income is $126,193.
Canberra
Canberra’s median house price is $964,136 and the median apartment price is $585,057.
Based on 40 percent serviceability, households need a total income of $144,158 to afford a home loan for a house and $87,478 for a unit. The city’s actual median household income is $137,760.
This stylish family home combines a classic palette and finishes with a flexible floorplan
Just 55 minutes from Sydney, make this your creative getaway located in the majestic Hawkesbury region.