How much income is required to service a mortgage? It depends on where you live
New research suggests spending 40 percent of household income on loan repayments is the new normal
 3 min
3 min
Requiring more than 30 percent of household income to service a home loan has long been considered the benchmark for ‘housing stress’. Yet research shows it is becoming the new normal. The 2024 ANZ CoreLogic Housing Affordability Report reveals home loans on only 17 percent of homes are ‘serviceable’ if serviceability is limited to 30 percent of the median national household income.
Based on 40 percent of household income, just 37 percent of properties would be serviceable on a mortgage covering 80 percent of the purchase price. ANZ CoreLogic suggest 40 may be the new 30 when it comes to home loan serviceability. “Looking ahead, there is little prospect for the mortgage serviceability indicator to move back into the 30 percent range any time soon,” says the report.
“This is because the cash rate is not expected to be cut until late 2024, and home values have continued to rise, even amid relatively high interest rate settings.” ANZ CoreLogic estimate that home loan rates would have to fall to about 4.7 percent to bring serviceability under 40 percent.
CoreLogic has broken down the actual household income required to service a home loan on a 6.27 percent interest rate for an 80 percent loan based on current median house and unit values in each capital city. As expected, affordability is worst in the most expensive property market, Sydney.
Sydney
Sydney’s median house price is $1,414,229 and the median unit price is $839,344.
Based on 40 percent serviceability, households need a total income of $211,456 to afford a home loan for a house and $125,499 for a unit. The city’s actual median household income is $120,554.
Melbourne
Melbourne’s median house price is $935,049 and the median apartment price is $612,906.
Based on 40 percent serviceability, households need a total income of $139,809 to afford a home loan for a house and $91,642 for a unit. The city’s actual median household income is $110,324.
Brisbane
Brisbane’s median house price is $909,988 and the median unit price is $587,793.
Based on 40 percent serviceability, households need a total income of $136,062 to afford a home loan for a house and $87,887 for a unit. The city’s actual median household income is $107,243.
Adelaide
Adelaide’s median house price is $785,971 and the median apartment price is $504,799.
Based on 40 percent serviceability, households need a total income of $117,519 to afford a home loan for a house and $75,478 for a unit. The city’s actual median household income is $89,806.
Perth
Perth’s median house price is $735,276 and the median unit price is $495,360.
Based on 40 percent serviceability, households need a total income of $109,939 to afford a home loan for a house and $74,066 for a unit. The city’s actual median household income is $108,057.
Hobart
Hobart’s median house price is $692,951 and the median apartment price is $522,258.
Based on 40 percent serviceability, households need a total income of $103,610 to afford a home loan for a house and $78,088 for a unit. The city’s actual median household income is $89,515.
Darwin
Darwin’s median house price is $573,498 and the median unit price is $367,716.
Based on 40 percent serviceability, households need a total income of $85,750 to afford a home loan for a house and $54,981 for a unit. The city’s actual median household income is $126,193.
Canberra
Canberra’s median house price is $964,136 and the median apartment price is $585,057.
Based on 40 percent serviceability, households need a total income of $144,158 to afford a home loan for a house and $87,478 for a unit. The city’s actual median household income is $137,760.

From bushland greens to valley reds, the country’s most awarded designers are proving that the best colour palette was never on a swatch card; it was outside the window all along.

The Australian leather house has opened an immersive four-day pop-up in Manhattan, unveiling its Bloom Collection and redefining what a product launch can look like.
Now selling from Level 9, this new tower pairs skyline and Harbour Bridge views with the quiet of Ismay Reserve, and pricing from just $560,000 for one, two and three-bedroom residences.
< 1 min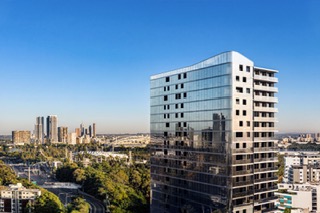
The skyline at Sydney’s Homebush is about to change, and The Maybelle is leading the charge.
The new residential tower has officially opened sales from Level 9, offering one, two and three-bedroom residences priced from $560,000, with move-in slated for late 2026.
What sets The Maybelle apart is its position. Residents on higher floors will wake up to sweeping city skyline and Harbour Bridge views.
The building overlooks the leafy calm of Ismay Reserve, giving owners the rare combination of a genuine outlook and a sense of green space, without compromising on either.
Location is doing plenty of the heavy lifting, too.
The Maybelle sits moments from the popular Homebush dining and lifestyle precinct, and is well connected to Strathfield, Sydney Olympic Park and the Sydney CBD, making it a strong option for buyers who want city access without giving up a slower pace at home.
For buyers considering their options in Sydney’s inner west, the appeal is straightforward: a genuine outlook, a connected address and an entry price that remains competitive for the location.
Registrations are now open for exclusive launch access. Get VIP access today.
Be the first to view floor plans, pricing, and availability before they are made public.
Register now at themaybelle.com.au or call 1300 066 292.

From citrus oils to warming spices, the classic G&T is being reimagined at home as a more thoughtful, seasonal ritual for modern entertaining.
From mud baths to herbal massages, Fiji’s heat rituals turned one winter escape into a soul-deep reset.