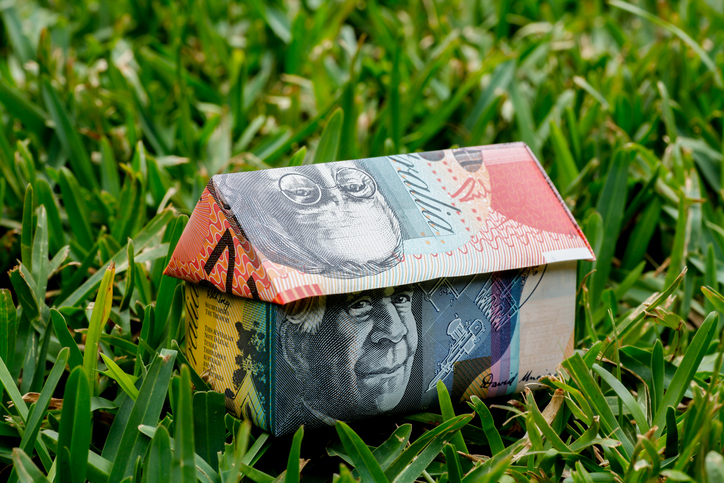


Why ‘Buying the Dip’ May Have Run Its Course
Why this time it looks different.

 3 min
3 min
“This time it’s different.” These can be the four most dangerous words that any investor can utter.
The phrase can trip up the unwary in myriad ways. “These valuations seem unsustainable,” one might contend. Don’t worry, this time it’s different. “This technology has failed every time it’s been tried before.” No problem, this time it’s different. Any of us can attempt to justify all sorts of wild schemes or nosebleed prices on the idea that they aren’t subject to the norms that have applied before.
But here’s the rub—sometimes it really is different. Major turning points occur when there is a secular change in the economy’s fortunes or a notable development that affects a company’s long-term prospects.
Think back to early 2020. The global Covid-19 outbreak was indeed something different, and markets fell precipitously. The massive monetary and fiscal stimuli that were offered in the crisis’s wake were something different as well, causing asset prices to leap. Enormous opportunities were available to those investors who astutely recognized the seismic shifts.
If we acknowledge that monetary and fiscal stimuli were key factors in the great bull run of the past 18 months, how do we reckon with the possibility that both may be coming to an end? Federal Reserve Chairman Jerome Powell recently acknowledged that the central bank would be tapering its $120 billion monthly bond purchases “soon” and would likely end them completely in a matter of months.
The Fed may be taking its foot off the monetary gas pedal, but it won’t yet be tapping the brakes by raising interest rates. It isn’t clear how markets will react to a less expansive monetary policy, even though one is likely to be upon us soon. Furthermore, investors appear uncomfortable with a Congress whose lack of progress on the debt ceiling, budget reconciliation, and infrastructure bills have turned fiscal policy from an economic tailwind to a potential headwind. And, after a long absence, inflation seems to be rearing its ugly head.
It should thus be no surprise, then, that volatility has returned to major U.S. indexes. Uncertainty begets volatility. Volatility ebbed when it was clear that market-friendly policies were in place and pushed higher after the Fed’s stance began to morph.
Each of the past three weeks has featured at least two days with over 1% changes in the S&P 500 index and at least one 2% decline in the Nasdaq 100. When the S&P hit an all-time high on Sept. 2, its 10-day historical volatility was 8.09. On Oct. 5, just over a month later and after four sequential 1% up and down days, that measure had nearly doubled to 15.76.
While implied volatilities on S&P 500 options have risen across the board, we recently noticed a significant change in the relative valuation of out-of-the-money options, or “skew.” Early this week, implied volatilities had risen most for options that are about 5% below market and barely budged for options that are 10% above market. This tells us that traders are focused on hedging a decline that would signify a normal correction and less eager to speculate on a significant short-term bounce.
Markets in general, and the options market in particular, are telling us that we should be concerned about how events could play out in the coming weeks. Contrarian traders who are risk-tolerant and well-capitalized could attempt to take advantage of the pricing disparity described above by selling put options to finance call-option purchases. But I would also suggest that investors consider whether their risk exposures are appropriate and use options to manage them in the face of a changing monetary policy and fiscal uncertainty.
Quite frankly, this time looks different.
Steve Sosnick is the chief strategist at Interactive Brokers.
Reprinted by permission of Barron’s. Copyright 2021 Dow Jones & Company. Inc. All Rights Reserved Worldwide. Original date of publication: October 7, 2021.
 Copyright 2020, Dow Jones & Company, Inc. All Rights Reserved Worldwide. LEARN MORE


This stylish family home combines a classic palette and finishes with a flexible floorplan

Just 55 minutes from Sydney, make this your creative getaway located in the majestic Hawkesbury region.

 3 min
3 min
An original watercolour illustration for the cover of Harry Potter and the Philosopher’s Stone, 1997 — the first book in J.K. Rowling’s hit series—could sell for US$600,000 at a Sotheby’s auction this summer.
The illustration is headlining a June 26 sale in New York that will also feature big-ticket items from the collection of the late Dr. Rodney P. Swantko, a surgeon and collector from Indiana, including manuscripts by poet Edgar Allan Poe and Arthur Conan Doyle, author of the Sherlock Holmes books
The Harry Potter illustration, which introduced the young wizard character to the world, is expected to sell for between US$400,000 to US$600,000, which would make it the highest-priced item ever sold related to the Harry Potter world. This is the second time the illustration has been sold, however—it was on the auction block at Sotheby’s in London in 2001, where it achieved £85,750 (US$107,316).
The artist of the illustration, Thomas Taylor, was 23 years old at the time and a graduate student working at a children’s bookshop. According to Sotheby’s, Taylor took a “professional commission from an unknown author to visualise a unique wizarding world,” Sotheby’s said in a news release. He depicted Harry Potter boarding the train to Hogwarts on platform9 ¾ platform, and the illustration became the “universal image” of the Harry Potter series, Sotheby’s said.
“It is exciting to see the painting that marks the very start of my career, decades later and as bright as ever! It takes me back to the experience of reading Harry Potter for the first time—one of the first people in the world to do so—and the process of creating what is now an iconic image,” Taylor said in the release.
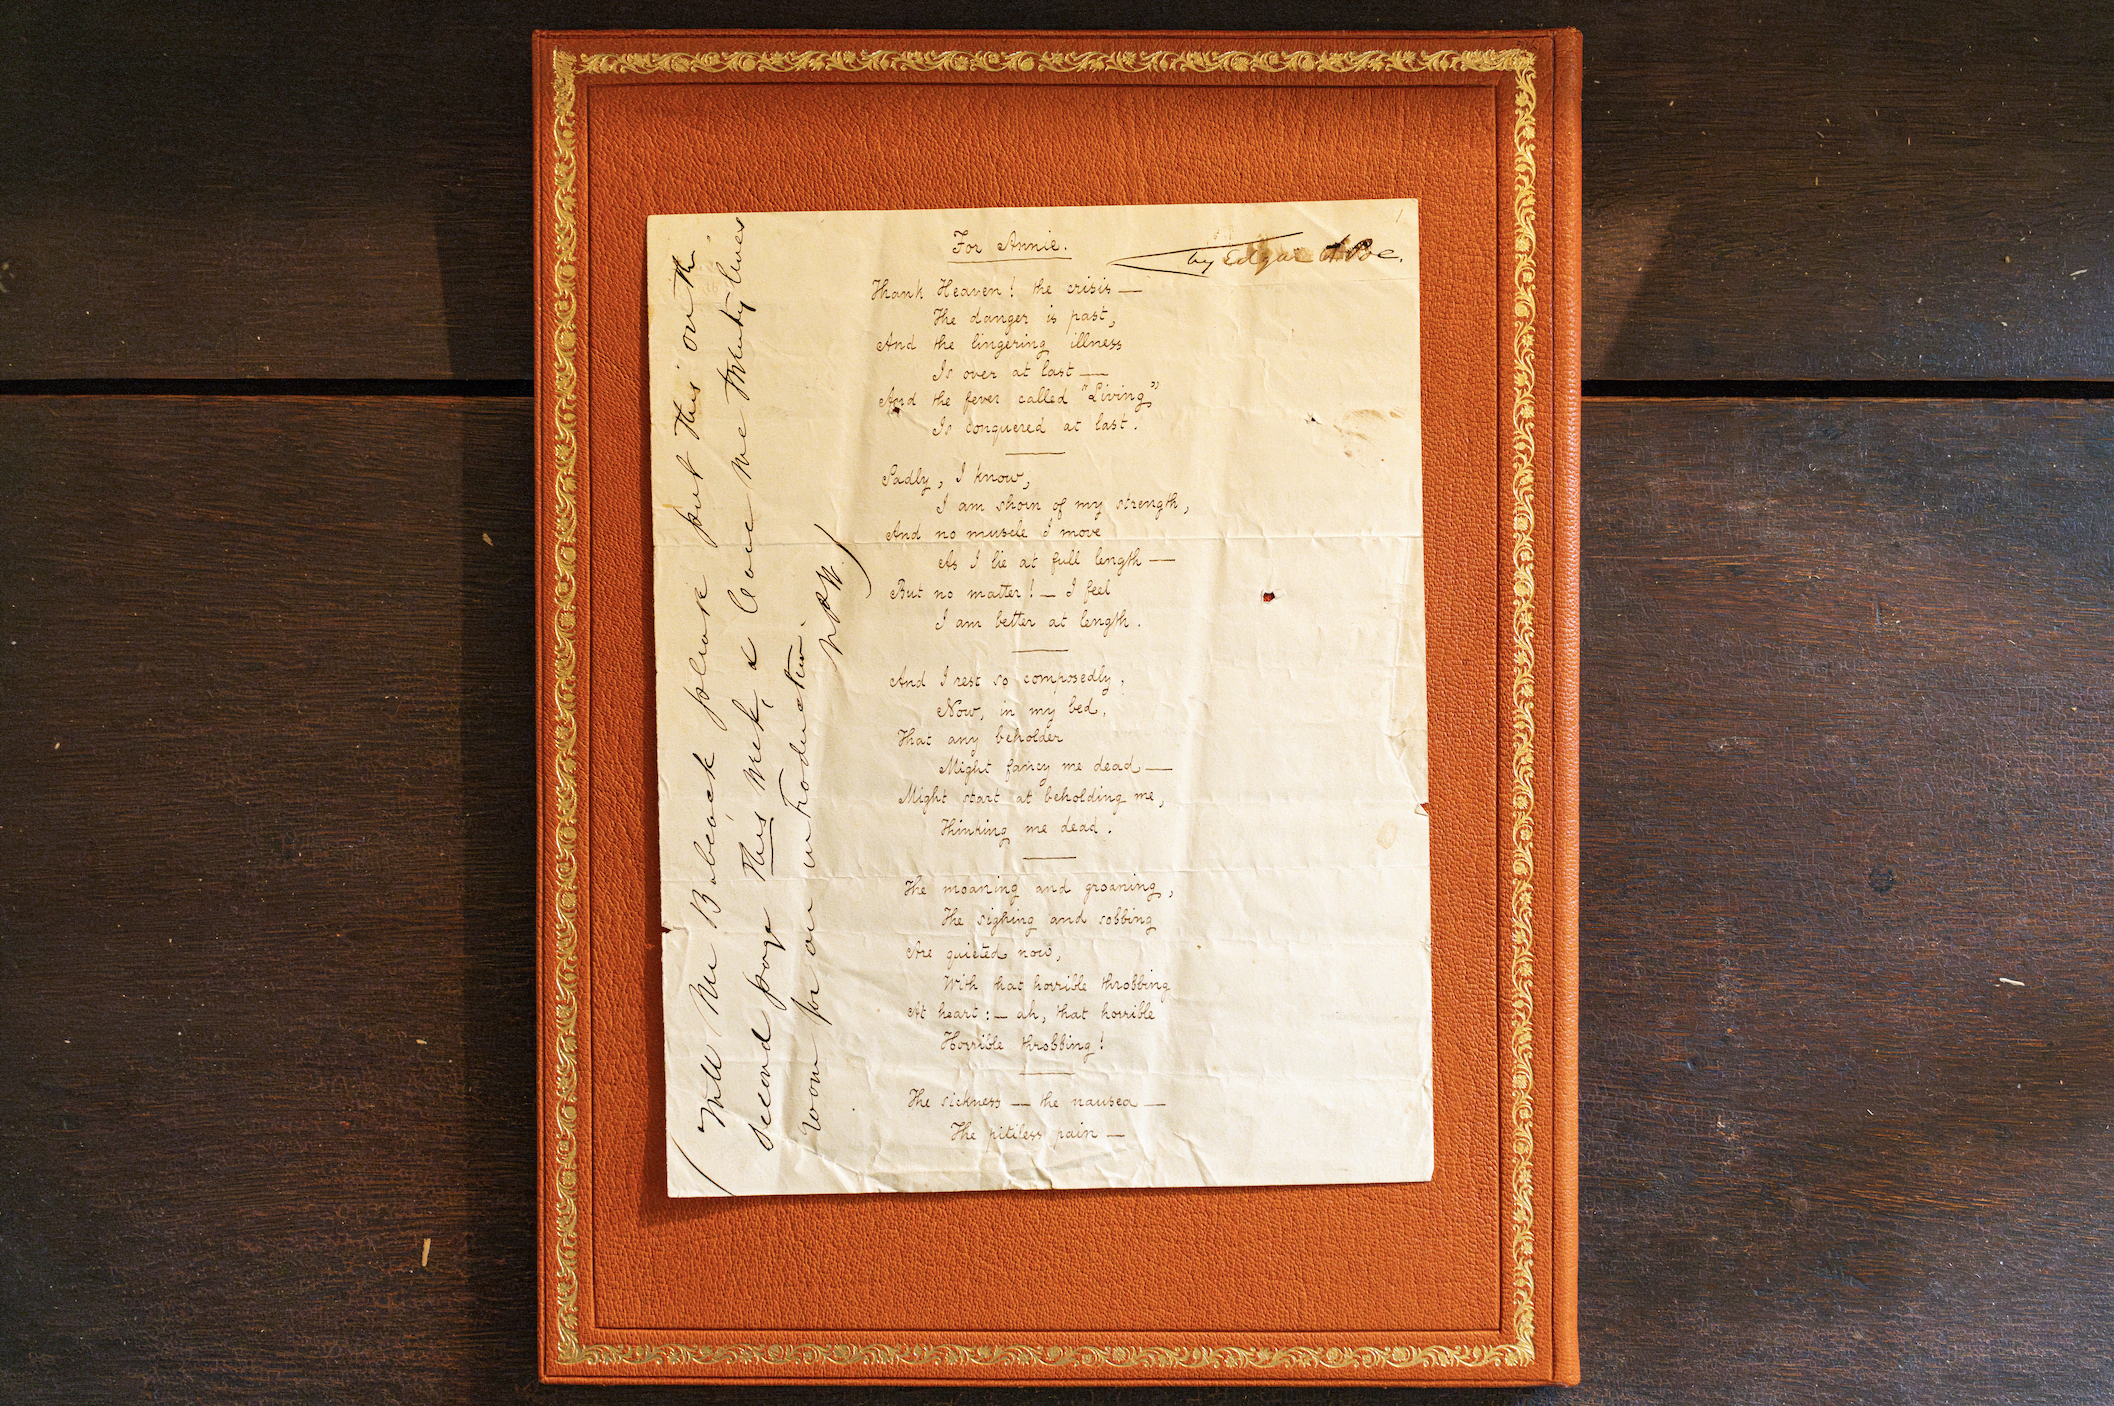
Meanwhile, to commemorate the 175th anniversary of Edgar Allan Poe’s For Annie , 1849, Sotheby’s recently reunited the autographed manuscript of the poem with the author’s home, Poe Cottage, in the Bronx.
The cottage is where the author lived with his wife, Virginia, and mother-in-law, Maria Clemm, from 1846 until he died in 1849. The manuscript, also from the Swantko collection, will remain at the home until it is offered at auction at Sotheby’s on June 26 with an estimate between US$400,000 and US$600,000.
Matthew Borowick for Sotheby’s
Poe Cottage, preserved and overseen by the Bronx County Historical Society, is home to many of the author’s famous works, including Eureka , 1948, and Annabel Lee , 1927.
“To reunite the For Annie manuscript with the Poe Cottage nearly two centuries after it was first composed brought to life literary history for a truly special and unique occasion,” Richard Austin , Sotheby’s Global Head of Books & Manuscripts, said in a news release.
For Annie was one of Poe’s most important compositions, and was addressed to Nancy “Annie” L. Richmond, one of the several women Poe pursued after his wife Viriginia’s death from tuberculosis in 1847.
In a letter to Richmond herself, Poe proclaimed For Annie was his best work: “I think the lines For Annie much the best I have ever written.”
The poem was composed in 1849, only months before Poe’s death, Sotheby’s said in the piece, Poe highlights the romantic comfort he feels from a woman named Annie while simultaneously grappling with the darkness of death, with lines like “And the fever called ‘living’ is conquered at last.”

Matthew Borowick for Sotheby’s
In the margins of the manuscript are the original handwritten instructions by Nathaniel P. Willis, co-editor of the New York Home Journal, where Poe published other poems such as The Raven and submitted For Annie on April 20, 1849.
Willis added Poe’s name in the top right and instructions about printing and presenting the poem on the side. The poem was also published in the Boston Weekly that same month.
Another piece of literary history included in the Swantko sale could surpass US$1 million. Conan Doyle’s autographed manuscript of the Sherlock Holmes tale The Sign of Four , 1889, is estimated to achieve between US$800,000 and US$1.2 million.
This stylish family home combines a classic palette and finishes with a flexible floorplan

Consumers are going to gravitate toward applications powered by the buzzy new technology, analyst Michael Wolf predicts