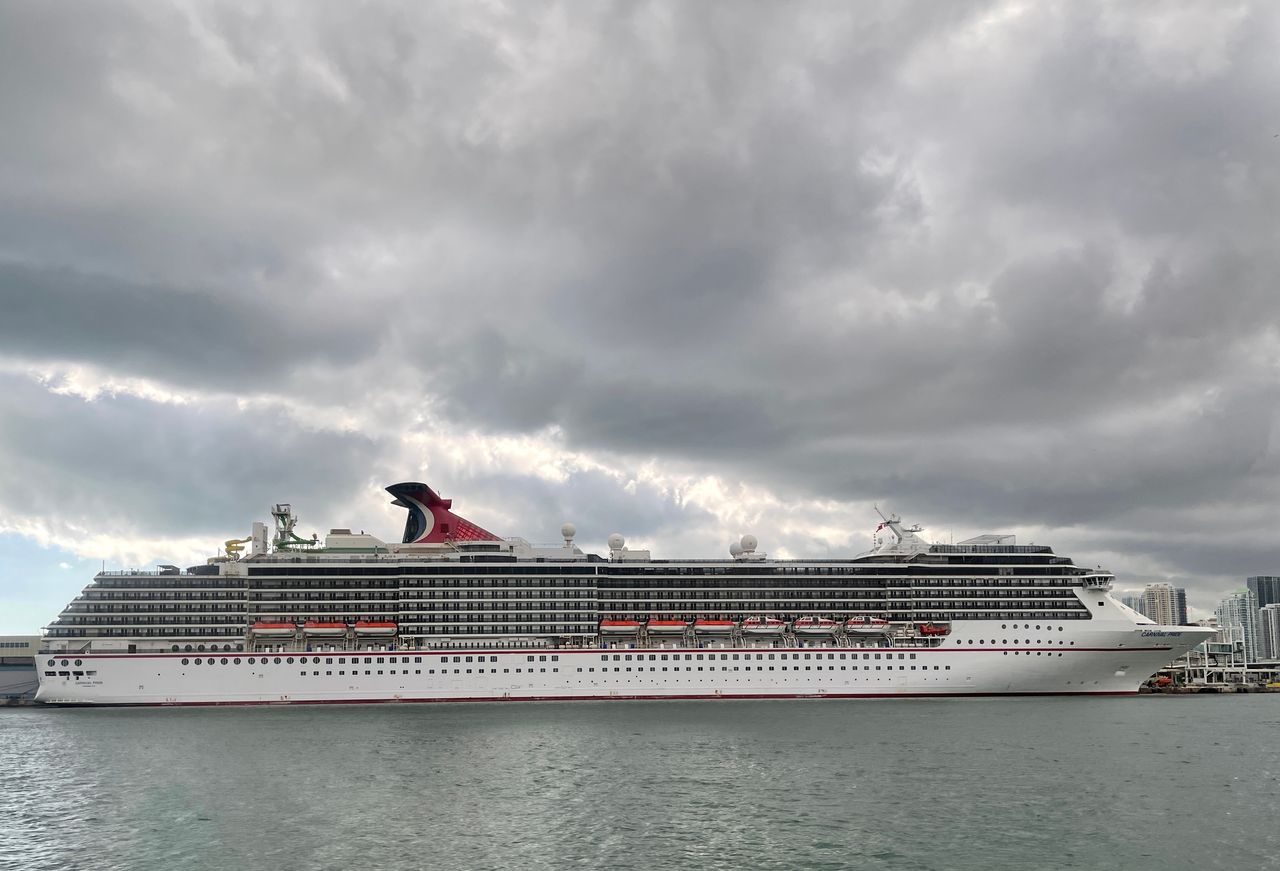
Cruise Stocks Get Upgraded by Macquarie, Because Covid’s Worst Is in the Past
Macquarie Research has upgraded the cruise stocks to Outperform, asserting that “most negative catalysts are in the rear-view mirror.”
Macquarie Research has upgraded the cruise stocks to Outperform, asserting that “most negative catalysts are in the rear-view mirror.”
Based on valuation, Paul Golding and Charles Yu of Macquarie wrote that they see the most upside in Norwegian Cruise Line Holdings (ticker: NCLH), followed by Carnival (CCL), and Royal Caribbean Group (RCL). They upgraded the stocks from Neutral.
Shares for Norwegian were at $31 and change Tuesday morning, up 4.6% in early trading, while Royal Caribbean and Carnival were also each up more than 4%.
The cruise operators have for the most part been unable to have any sailings for about a year due to the pandemic. A key question is when sailings in and out of U.S. reports will resume. The Centers for Disease Control and Prevention issued a conditional sail order last October, but U.S. sailings haven’t resumed. The cruise companies have suspended their U.S. sailings well into the spring.
Golding and Yu wrote that “technical instructions from the CDC are also forthcoming and could drive more confidence.”
In an email to Barron’s early last month, a CDC representative wrote: “Future orders and technical instructions will address additional activities to help cruise lines prepare for and return to passenger operations in a manner that mitigates COVID-19 risk among passengers, crew members, including simulated voyages, certification for conditional sailing, and restricted voyages.”
Although still well below their pre-pandemic levels in early 2020, the cruise stocks have been moving up as investors get more confident about a reopening of the economy. As of Monday’s close, the stocks of all three companies were up by at least 15% year to date.
Besides forthcoming guidance from the CDC, macro catalysts for the cruise companies include “an expectation of sufficient vaccine efficacy for consumers to feel comfortable engaging in leisure activities.”
“While shares have bounced quite a way off their 1-[year] lows, and barring recession or a sector rerating, the catalysts should trend more positive from here into summer,” they wrote.
The research note points out that Carnival’s announcement last month that it had closed on a $3.5 billion senior unsecured debt offering “bodes well” for its liquidity situation and for the industry’s. “It demonstrates the potential for the group to continue to fund operations even if the suspension gets drawn out,” they noted.
Separately, Carnival announced last month that it had priced an offering for its 40.5 million shares of common stock at $25.10. That adds up to about $1 billion of additional capital, one of various steps the company has taken to shore up its liquidity as its ships sit idle and it burns through hundreds of millions of dollars every month.
 Copyright 2020, Dow Jones & Company, Inc. All Rights Reserved Worldwide. LEARN MORE
This stylish family home combines a classic palette and finishes with a flexible floorplan
Just 55 minutes from Sydney, make this your creative getaway located in the majestic Hawkesbury region.
New research suggests spending 40 percent of household income on loan repayments is the new normal
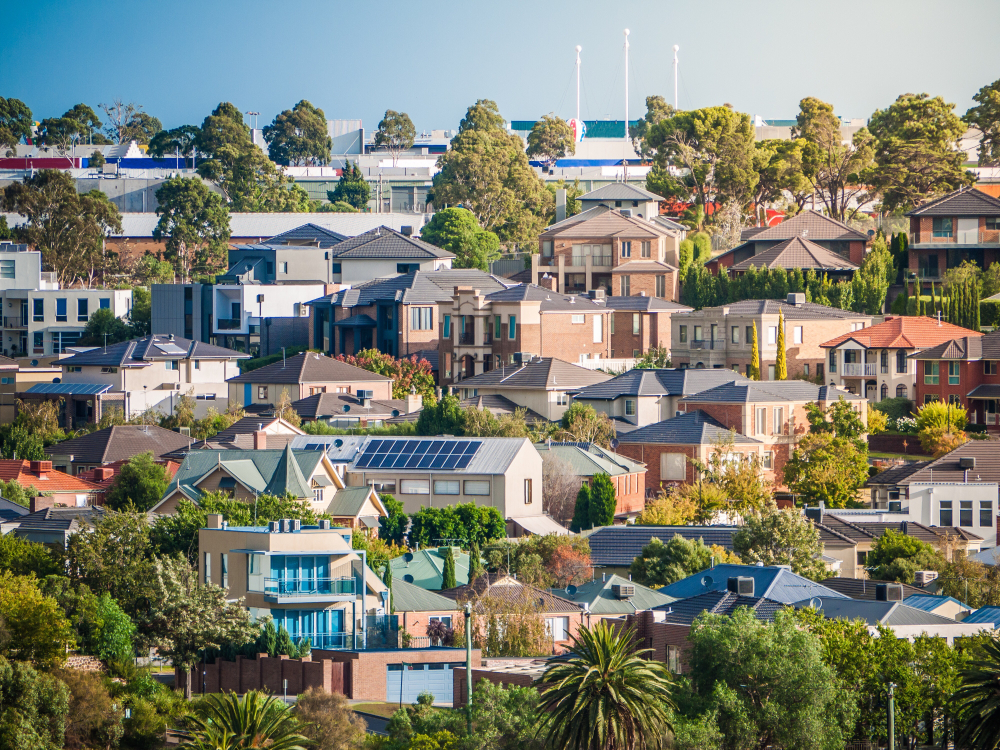
Requiring more than 30 percent of household income to service a home loan has long been considered the benchmark for ‘housing stress’. Yet research shows it is becoming the new normal. The 2024 ANZ CoreLogic Housing Affordability Report reveals home loans on only 17 percent of homes are ‘serviceable’ if serviceability is limited to 30 percent of the median national household income.
Based on 40 percent of household income, just 37 percent of properties would be serviceable on a mortgage covering 80 percent of the purchase price. ANZ CoreLogic suggest 40 may be the new 30 when it comes to home loan serviceability. “Looking ahead, there is little prospect for the mortgage serviceability indicator to move back into the 30 percent range any time soon,” says the report.
“This is because the cash rate is not expected to be cut until late 2024, and home values have continued to rise, even amid relatively high interest rate settings.” ANZ CoreLogic estimate that home loan rates would have to fall to about 4.7 percent to bring serviceability under 40 percent.
CoreLogic has broken down the actual household income required to service a home loan on a 6.27 percent interest rate for an 80 percent loan based on current median house and unit values in each capital city. As expected, affordability is worst in the most expensive property market, Sydney.
Sydney
Sydney’s median house price is $1,414,229 and the median unit price is $839,344.
Based on 40 percent serviceability, households need a total income of $211,456 to afford a home loan for a house and $125,499 for a unit. The city’s actual median household income is $120,554.
Melbourne
Melbourne’s median house price is $935,049 and the median apartment price is $612,906.
Based on 40 percent serviceability, households need a total income of $139,809 to afford a home loan for a house and $91,642 for a unit. The city’s actual median household income is $110,324.
Brisbane
Brisbane’s median house price is $909,988 and the median unit price is $587,793.
Based on 40 percent serviceability, households need a total income of $136,062 to afford a home loan for a house and $87,887 for a unit. The city’s actual median household income is $107,243.
Adelaide
Adelaide’s median house price is $785,971 and the median apartment price is $504,799.
Based on 40 percent serviceability, households need a total income of $117,519 to afford a home loan for a house and $75,478 for a unit. The city’s actual median household income is $89,806.
Perth
Perth’s median house price is $735,276 and the median unit price is $495,360.
Based on 40 percent serviceability, households need a total income of $109,939 to afford a home loan for a house and $74,066 for a unit. The city’s actual median household income is $108,057.
Hobart
Hobart’s median house price is $692,951 and the median apartment price is $522,258.
Based on 40 percent serviceability, households need a total income of $103,610 to afford a home loan for a house and $78,088 for a unit. The city’s actual median household income is $89,515.
Darwin
Darwin’s median house price is $573,498 and the median unit price is $367,716.
Based on 40 percent serviceability, households need a total income of $85,750 to afford a home loan for a house and $54,981 for a unit. The city’s actual median household income is $126,193.
Canberra
Canberra’s median house price is $964,136 and the median apartment price is $585,057.
Based on 40 percent serviceability, households need a total income of $144,158 to afford a home loan for a house and $87,478 for a unit. The city’s actual median household income is $137,760.
This stylish family home combines a classic palette and finishes with a flexible floorplan
Consumers are going to gravitate toward applications powered by the buzzy new technology, analyst Michael Wolf predicts


