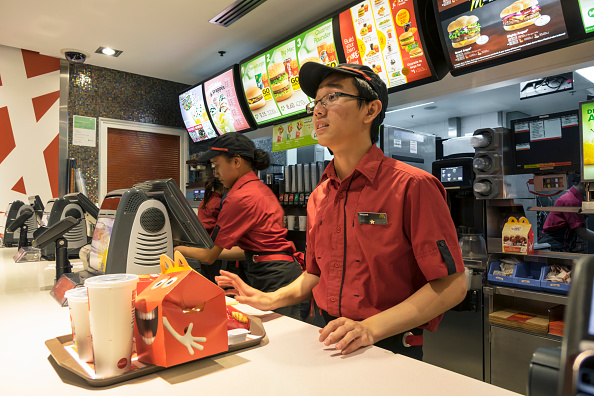
Job mobility rates at highest levels in a decade
Kanebridge News
    HOUSE MEDIAN ASKING PRICES AND WEEKLY CHANGE     Sydney $1,641,773 (+0.89%)       Melbourne $986,710 (+0.32%)       Brisbane $1,021,281 (-0.20%)       Adelaide $935,576 (+2.61%)       Perth $916,604 (+1.57%)       Hobart $747,530 (+0.06%)       Darwin $694,960 (+0.13%)       Canberra $955,820 (+0.49%)       National $1,061,087 (+0.80%)                UNIT MEDIAN ASKING PRICES AND WEEKLY CHANGE     Sydney $771,811 (-0.11%)       Melbourne $497,462 (-0.03%)       Brisbane $617,063 (-1.04%)       Adelaide $462,046 (-1.38%)       Perth $490,445 (-0.33%)       Hobart $517,941 (+0.68%)       Darwin $396,797 (+8.47%)       Canberra $501,782 (-0.79%)       National $553,526 (-0.09%)                HOUSES FOR SALE AND WEEKLY CHANGE     Sydney 12,712 (+1,105)       Melbourne 16,823 (+343)       Brisbane 8,826 (+74)       Adelaide 2,590 (+231)       Perth 6,989 (+299)       Hobart 1,189 (+60)       Darwin 285 (+1)       Canberra 1,223 (+49)       National 50,637 (+2,162)                UNITS FOR SALE AND WEEKLY CHANGE     Sydney 10,136 (+173)       Melbourne 9,004 (-62)       Brisbane 1,749 (+13)       Adelaide 453 (+5)       Perth 1,582 (+67)       Hobart 202 (+1)       Darwin 328 (-5)       Canberra 1,110 (+4)       National 24,564 (+196)                HOUSE MEDIAN ASKING RENTS AND WEEKLY CHANGE     Sydney $800 ($0)       Melbourne $600 ($0)       Brisbane $640 ($0)       Adelaide $600 ($0)       Perth $670 ($0)       Hobart $550 ($0)       Darwin $760 (+$10)       Canberra $680 (+$10)       National $672 (+$3)                UNIT MEDIAN ASKING RENTS AND WEEKLY CHANGE     Sydney $733 (-$8)       Melbourne $560 (-$5)       Brisbane $620 (-$5)       Adelaide $490 (-$8)       Perth $620 (+$20)       Hobart $450 ($0)       Darwin $550 (-$15)       Canberra $550 ($0)       National $583 (-$2)                HOUSES FOR RENT AND WEEKLY CHANGE     Sydney 5,793 (-16)       Melbourne 7,032 (+191)       Brisbane 4,223 (+22)       Adelaide 1,379 (+3)       Perth 2,274 (-59)       Hobart 230 (+3)       Darwin 112 (+7)       Canberra 515 (+27)       National 21,558 (+178)                UNITS FOR RENT AND WEEKLY CHANGE     Sydney 9,437 (+67)       Melbourne 6,688 (+64)       Brisbane 2,240 (-15)       Adelaide 374 (-10)       Perth 598 (+20)       Hobart 99 (-16)       Darwin 244 (0)       Canberra 740 (-2)       National 20,420 (+108)                HOUSE ANNUAL GROSS YIELDS AND TREND         Sydney 2.53% (↓)       Melbourne 3.16% (↓)     Brisbane 3.26% (↑)        Adelaide 3.33% (↓)       Perth 3.80% (↓)       Hobart 3.83% (↓)     Darwin 5.69% (↑)      Canberra 3.70% (↑)        National 3.29% (↓)            UNIT ANNUAL GROSS YIELDS AND TREND         Sydney 4.94% (↓)       Melbourne 5.85% (↓)     Brisbane 5.22% (↑)        Adelaide 5.51% (↓)     Perth 6.57% (↑)        Hobart 4.52% (↓)       Darwin 7.21% (↓)     Canberra 5.70% (↑)        National 5.48% (↓)            HOUSE RENTAL VACANCY RATES AND TREND       Sydney 0.8% (↑)      Melbourne 0.7% (↑)      Brisbane 0.7% (↑)      Adelaide 0.4% (↑)      Perth 0.4% (↑)      Hobart 0.9% (↑)      Darwin 0.8% (↑)      Canberra 1.0% (↑)      National 0.7% (↑)             UNIT RENTAL VACANCY RATES AND TREND       Sydney 0.9% (↑)      Melbourne 1.1% (↑)      Brisbane 1.0% (↑)      Adelaide 0.5% (↑)      Perth 0.5% (↑)      Hobart 1.4% (↑)      Darwin 1.7% (↑)      Canberra 1.4% (↑)      National 1.1% (↑)             AVERAGE DAYS TO SELL HOUSES AND TREND       Sydney 28.8 (↑)      Melbourne 31.1 (↑)      Brisbane 31.4 (↑)      Adelaide 24.1 (↑)        Perth 35.7 (↓)       Hobart 28.4 (↓)     Darwin 42.2 (↑)      Canberra 29.4 (↑)      National 31.4 (↑)             AVERAGE DAYS TO SELL UNITS AND TREND       Sydney 28.7 (↑)        Melbourne 31.3 (↓)     Brisbane 31.6 (↑)        Adelaide 22.9 (↓)     Perth 36.5 (↑)        Hobart 28.8 (↓)     Darwin 41.8 (↑)        Canberra 36.2 (↓)     National 32.2 (↑)            
Share Button

Job mobility rates at highest levels in a decade

Having trouble finding and keeping staff? You’re not alone, new figures show

By KANEBRIDGE NEWS
Fri, Jun 30, 2023 12:30pmGrey Clock < 1 min

Almost one in every 10 Australian workers changed jobs in the 12 months to February this year, new data from the Australian Bureau of Statistics reveals.

The new figures released today show that 9.5 percent or 1.3 million Australian workers changed their employer or business, the highest level in a decade.

ABS head of labour statistics, Bjorn Jarvis, said job mobility had slowed over the pandemic.

“Job mobility in Australia has generally been trending down for decades and reached a record low of 7.5 percent during the first year of the COVID-19 pandemic,” he said. “While the 2023 figure might be higher, and is in fact the highest it’s been since the early 2010s, it’s still relatively low compared to earlier decades.”

While job mobility was highest among labourers, machinery operators and sales workers, Mr Jarvis said workers were more inclined to change industries than occupations.

“People were more likely to change their industry, at 58 per cent, than their occupation, which was 44 per cent, in the year ending in February 2023,” Mr Jarvis said.

Younger workers continued to represent the highest levels of those seeking new roles, with 14.9 of 15 to 24 year olds changing jobs. At the other end of the workforce, those in the 45 to 64 year old age bracket were less inclined to move, with 5.9 percent moving on from their previous job or business.

The ABS also found that there were 1.8 million Australians who identified as potential workers, including 510,000 unemployed people and 1.3 million not in the labour force.


MOST POPULAR
11 ACRES ROAD, KELLYVILLE, NSW

This stylish family home combines a classic palette and finishes with a flexible floorplan

35 North Street Windsor

Just 55 minutes from Sydney, make this your creative getaway located in the majestic Hawkesbury region.

Related Stories
Lifestyle
An Unforgettable Meal Can Cost $5 at Singapore’s Hawker Centres. Can the Next Generation Save Them?
By SEBASTIAN MODAK 18/10/2024
Lifestyle
Beefy, Austrian-Made Camper Van Aims to Drive America’s Glampers off the Beaten Path
By JIM MOTAVALLI 18/10/2024
Money
New Zealand Inflation Eases, Opening Path for Big Rate Cuts
By JAMES GLYNN 17/10/2024
New Zealand Inflation Eases, Opening Path for Big Rate Cuts

The inflation rate ran at an annual pace of 2.2% in the quarter compared with a rise of 3.3% in the second quarter

By JAMES GLYNN
Thu, Oct 17, 2024 2 min

SYDNEY—New Zealand’s inflation rate returned to within the central bank’s target band for the first time since early 2021 in the third quarter, opening a path to more supersized interest-rate cuts in coming months.

The inflation rate ran at an annual pace of 2.2% in the quarter, near the midpoint of the desired 1% to 3% target band, with some economists warning that the Reserve Bank of New Zealand must continue lowering the official cash rate at speed as a neutral policy rate is still well off in the distance.

The annual increase in inflation compares with a rise of 3.3% in the second quarter, StatsNZ said Wednesday. Inflation rose by 0.6% in quarterly terms.

The inflation data justifies the 75 basis points of cuts announced so far since August, with the RBNZ stepping up the pace of lowering the official cash rate last week by joining the Federal Reserve in slashing by 50 basis points.

Economists warn that there is a risk that inflation will undershoot the target band in coming quarters, especially if the RBNZ backs away from more significant cuts.

The official cash rate has so far fallen to 4.75% from 5.50%, with a neutral policy rate likely closer to 3.00%, according to economists.

New Zealand’s farm-rich economy has been in and out of recession for years as the RBNZ proved to be one of the more aggressive central banks globally when combating the inflation surge that emerged after the Covid-19 pandemic.

Economic activity remains flat and in need of resuscitation, especially with growth in China, its main trading partner, in a slowdown, economists said.

Higher rents were the biggest contributor to the annual inflation rate, up 4.5%. Almost a fifth of the annual increase in the consumer-price index was due to rent prices.

Prices for local authority rates and payments increased 12.2% in the 12 months to the third quarter, StatsNZ said. Prices for cigarettes and tobacco also rose sharply in line with an annual excise-tax increase.

Still, lower prices for gasoline and vegetables helped to offset rising prices, StatsNZ added.

MOST POPULAR
11 ACRES ROAD, KELLYVILLE, NSW

This stylish family home combines a classic palette and finishes with a flexible floorplan

35 North Street Windsor

Just 55 minutes from Sydney, make this your creative getaway located in the majestic Hawkesbury region.

Related Stories
Money
Why Cheap Toilet Paper Sets Off Alarm Bells Among Some Investors
By AARON BACK 03/07/2024
Money
Under pressure: More Australians are over extending to keep up appearances
By KANEBRIDGE NEWS 08/10/2024
Property
Property of the Week: Yverlyn Farm, 44 Rishworths Lane, Brooklet
By Kirsten Craze 27/09/2024
0
    Your Cart
    Your cart is emptyReturn to Shop