All Aboard the Stock-Market Solar Coaster
Much of the climb in solar stocks looks justified by growth prospects, but buyers may still be in for a bumpy ride

 2 min
2 min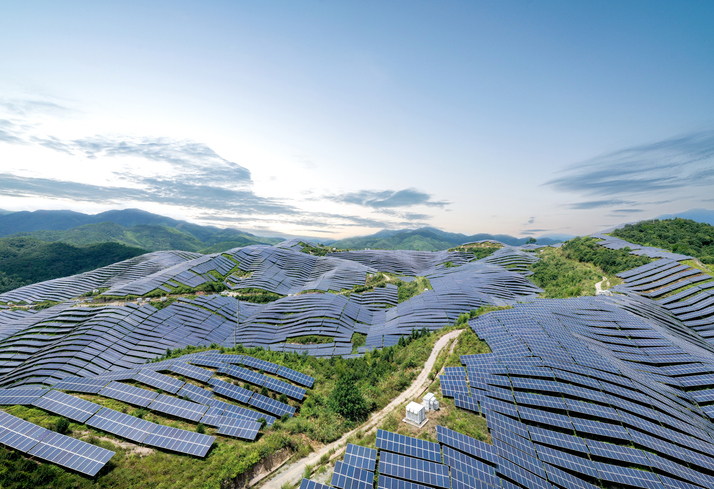
Solar stocks are sizzling—quite an accomplishment for the simplest and most mature of the green-energy technologies. Finding companies that could keep shining might require looking in less obvious places.
The MAC Global Solar Energy Index has generated a 233% return including dividends for dollar investors during the past year. That is well ahead of returns from wind-turbine makers Vestas and Siemens Gamesa, nevermind the S&P 500’s 15%.
As public and political support for green power has broadened, markets have come to expect a decadeslong renewables rollout. It is hard to see any catalyst for a change in sentiment, says Sam Arie, a veteran utilities analyst at UBS. Solar panels can be the cheapest way to generate electricity in many parts of the world. “In some cases it is even cheaper to build a new solar farm than run existing coal plants,” says Alex Monk, a portfolio manager at asset manager Schroders.
The catch is that the shift to renewables doesn’t guarantee shareholder returns. To justify high valuations, investors need to ensure companies have a defensible business as well as growth prospects.
Solar investors have already experienced at least two stomach-churning cycles. A key lesson has been that making panels themselves is a low-margin, hypercompetitive market best avoided. But other parts of the value chain offer better prospects.
For example, SolarEdge and Enphase make power inverters, which convert a solar panel’s power to alternating current and adjust performance to maximize output. Their Nasdaq-listed shares have returned 179% and 444% respectively during the past year and now trade for 72 and 93 times forward earnings. That is a lot of growth priced in. However, the technologies are patent-protected and could also be central to managing a smart home’s power between electric vehicles, solar panels, batteries and the like—a potentially vast market.
Developers are another option. They bid for, build and run solar farms. While installing the panels isn’t complex, experience is valuable when pricing bids and navigating the permitting process, and scale is crucial to sourcing panels effectively.
NextEra Energy, Enel and Iberdrola have built huge renewable-power farms as part of wider utility businesses and have ambitious rollout plans for solar and wind. Their shares have given investors total returns of between 16% and 28% over a year, and now change hands for between 15 and 32 times forward earnings. Barclays utilities analyst Dominic Nash credits part of the rise to general growth investors coming into the sector for the first time.
Then there are U.S. residential developers, which offer homeowners rooftop solar-panels paired with battery storage. The products provide added reliability, and monthly payments for the cost of batteries and solar panels that are often lower than existing utility bills. “It’s a pretty easy sale,” says Stephen Byrd, an analyst at Morgan Stanley.
Shares in SunPower and Sunrun, two such developers, trade at Tesla-type multiples, 118 times and 360 times forward earnings respectively. Revenues will grow—U.S. solar penetration will rise from 3% now to 14% by 2030, says Mr. Byrd—but margins will also come under pressure once installers compete head-to-head rather than with incumbent utilities.
Investors need to choose carefully as the stock-market solar coaster speeds up again. The general direction of travel may be up, but it likely still has plenty of twists and turns in store.
 Copyright 2020, Dow Jones & Company, Inc. All Rights Reserved Worldwide. LEARN MORE


This stylish family home combines a classic palette and finishes with a flexible floorplan

Just 55 minutes from Sydney, make this your creative getaway located in the majestic Hawkesbury region.


Continued stagflation and cost of living pressures are causing couples to think twice about starting a family, new data has revealed, with long term impacts expected
2 min
Australia is in the midst of a ‘baby recession’ with preliminary estimates showing the number of births in 2023 fell by more than four percent to the lowest level since 2006, according to KPMG. The consultancy firm says this reflects the impact of cost-of-living pressures on the feasibility of younger Australians starting a family.
KPMG estimates that 289,100 babies were born in 2023. This compares to 300,684 babies in 2022 and 309,996 in 2021, according to the Australian Bureau of Statistics (ABS). KPMG urban economist Terry Rawnsley said weak economic growth often leads to a reduced number of births. In 2023, ABS data shows gross domestic product (GDP) fell to 1.5 percent. Despite the population growing by 2.5 percent in 2023, GDP on a per capita basis went into negative territory, down one percent over the 12 months.
“Birth rates provide insight into long-term population growth as well as the current confidence of Australian families,” said Mr Rawnsley. “We haven’t seen such a sharp drop in births in Australia since the period of economic stagflation in the 1970s, which coincided with the initial widespread adoption of the contraceptive pill.”
Mr Rawnsley said many Australian couples delayed starting a family while the pandemic played out in 2020. The number of births fell from 305,832 in 2019 to 294,369 in 2020. Then in 2021, strong employment and vast amounts of stimulus money, along with high household savings due to lockdowns, gave couples better financial means to have a baby. This led to a rebound in births.
However, the re-opening of the global economy in 2022 led to soaring inflation. By the start of 2023, the Australian consumer price index (CPI) had risen to its highest level since 1990 at 7.8 percent per annum. By that stage, the Reserve Bank had already commenced an aggressive rate-hiking strategy to fight inflation and had raised the cash rate every month between May and December 2022.
Five more rate hikes during 2023 put further pressure on couples with mortgages and put the brakes on family formation. “This combination of the pandemic and rapid economic changes explains the spike and subsequent sharp decline in birth rates we have observed over the past four years,” Mr Rawnsley said.
The impact of high costs of living on couples’ decision to have a baby is highlighted in births data for the capital cities. KPMG estimates there were 60,860 births in Sydney in 2023, down 8.6 percent from 2019. There were 56,270 births in Melbourne, down 7.3 percent. In Perth, there were 25,020 births, down 6 percent, while in Brisbane there were 30,250 births, down 4.3 percent. Canberra was the only capital city where there was no fall in the number of births in 2023 compared to 2019.
“CPI growth in Canberra has been slightly subdued compared to that in other major cities, and the economic outlook has remained strong,” Mr Rawnsley said. “This means families have not been hurting as much as those in other capital cities, and in turn, we’ve seen a stabilisation of births in the ACT.”
This stylish family home combines a classic palette and finishes with a flexible floorplan
Just 55 minutes from Sydney, make this your creative getaway located in the majestic Hawkesbury region.