American Finance Has Left Europe In the Dust. The Tables Aren’t Turning.
Kanebridge News
    HOUSE MEDIAN ASKING PRICES AND WEEKLY CHANGE     Sydney $1,643,886 (+0.13%)       Melbourne $988,526 (+0.18%)       Brisbane $1,027,262 (+0.59%)       Adelaide $921,236 (-1.53%)       Perth $913,258 (-0.37%)       Hobart $750,852 (+0.44%)       Darwin $705,508 (+1.52%)       Canberra $959,740 (+0.41%)       National $1,061,930 (+0.08%)                UNIT MEDIAN ASKING PRICES AND WEEKLY CHANGE     Sydney $765,156 (-0.86%)       Melbourne $497,287 (-0.04%)       Brisbane $603,986 (-2.12%)       Adelaide $458,533 (-0.76%)       Perth $487,745 (-0.55%)       Hobart $518,973 (+0.20%)       Darwin $390,036 (-1.70%)       Canberra $500,797 (-0.20%)       National $548,954 (-0.83%)                HOUSES FOR SALE AND WEEKLY CHANGE     Sydney 13,017 (+305)       Melbourne 16,861 (+38)       Brisbane 8,920 (+94)       Adelaide 2,683 (+93)       Perth 7,123 (+134)       Hobart 1,216 (+27)       Darwin 285 (0)       Canberra 1,288 (+65)       National 51,393 (+756)                UNITS FOR SALE AND WEEKLY CHANGE     Sydney 10,097 (-39)       Melbourne 9,079 (+75)       Brisbane 1,777 (+28)       Adelaide 464 (+11)       Perth 1,635 (+53)       Hobart 208 (+6)       Darwin 331 (+3)       Canberra 1,135 (+25)       National 24,726 (+162)                HOUSE MEDIAN ASKING RENTS AND WEEKLY CHANGE     Sydney $800 ($0)       Melbourne $600 ($0)       Brisbane $640 ($0)       Adelaide $600 ($0)       Perth $675 (+$5)       Hobart $550 ($0)       Darwin $750 (-$10)       Canberra $680 ($0)       National $671 (-$1)                UNIT MEDIAN ASKING RENTS AND WEEKLY CHANGE     Sydney $740 (+$8)       Melbourne $560 ($0)       Brisbane $620 ($0)       Adelaide $490 ($0)       Perth $620 ($0)       Hobart $450 ($0)       Darwin $570 (+$20)       Canberra $550 ($0)       National $587 (+$4)                HOUSES FOR RENT AND WEEKLY CHANGE     Sydney 5,925 (+132)       Melbourne 7,088 (+56)       Brisbane 4,248 (+25)       Adelaide 1,340 (-39)       Perth 2,195 (-79)       Hobart 227 (-3)       Darwin 116 (+4)       Canberra 507 (-8)       National 21,646 (+88)                UNITS FOR RENT AND WEEKLY CHANGE     Sydney 9,513 (+76)       Melbourne 6,738 (+50)       Brisbane 2,310 (+70)       Adelaide 375 (+1)       Perth 609 (+11)       Hobart 102 (+3)       Darwin 260 (+16)       Canberra 699 (-41)       National 20,606 (+186)                HOUSE ANNUAL GROSS YIELDS AND TREND         Sydney 2.53% (↓)       Melbourne 3.16% (↓)       Brisbane 3.24% (↓)     Adelaide 3.39% (↑)      Perth 3.84% (↑)        Hobart 3.81% (↓)       Darwin 5.53% (↓)       Canberra 3.68% (↓)       National 3.29% (↓)            UNIT ANNUAL GROSS YIELDS AND TREND       Sydney 5.03% (↑)      Melbourne 5.86% (↑)      Brisbane 5.34% (↑)      Adelaide 5.56% (↑)      Perth 6.61% (↑)        Hobart 4.51% (↓)     Darwin 7.60% (↑)      Canberra 5.71% (↑)      National 5.56% (↑)             HOUSE RENTAL VACANCY RATES AND TREND       Sydney 0.8% (↑)      Melbourne 0.7% (↑)      Brisbane 0.7% (↑)      Adelaide 0.4% (↑)      Perth 0.4% (↑)      Hobart 0.9% (↑)      Darwin 0.8% (↑)      Canberra 1.0% (↑)      National 0.7% (↑)             UNIT RENTAL VACANCY RATES AND TREND       Sydney 0.9% (↑)      Melbourne 1.1% (↑)      Brisbane 1.0% (↑)      Adelaide 0.5% (↑)      Perth 0.5% (↑)      Hobart 1.4% (↑)      Darwin 1.7% (↑)      Canberra 1.4% (↑)      National 1.1% (↑)             AVERAGE DAYS TO SELL HOUSES AND TREND       Sydney 29.4 (↑)      Melbourne 31.4 (↑)        Brisbane 31.4 (↓)     Adelaide 24.8 (↑)      Perth 36.0 (↑)      Hobart 30.1 (↑)        Darwin 40.3 (↓)       Canberra 28.9 (↓)     National 31.5 (↑)             AVERAGE DAYS TO SELL UNITS AND TREND       Sydney 30.0 (↑)      Melbourne 32.2 (↑)        Brisbane 31.1 (↓)     Adelaide 23.4 (↑)        Perth 36.2 (↓)     Hobart 32.4 (↑)      Darwin 42.6 (↑)        Canberra 36.0 (↓)     National 33.0 (↑)            
Share Button

American Finance Has Left Europe In the Dust. The Tables Aren’t Turning.

Restoring the competitiveness of European banks and asset managers can’t be achieved by tweaking regulations

By JON SINDREU
Fri, Jan 12, 2024 8:50amGrey Clock 3 min

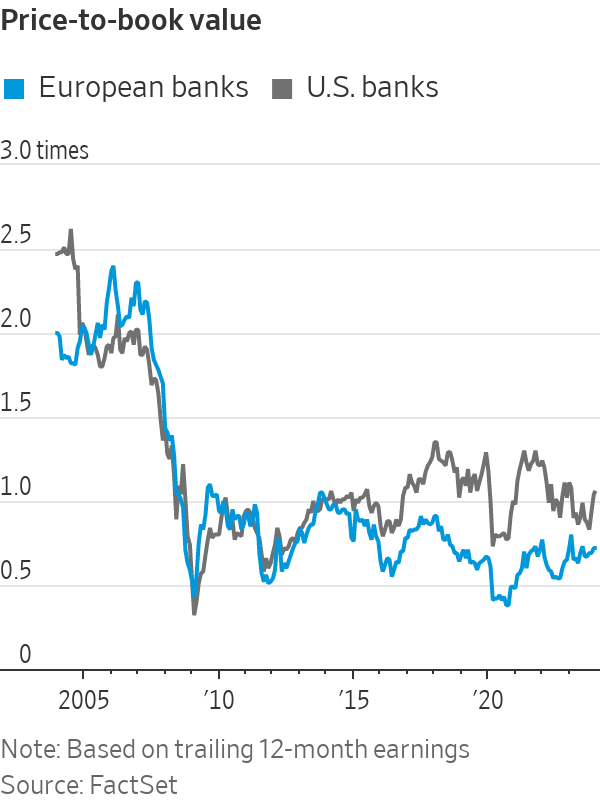
After a decade and a half of seeing the U.S. economy pull ahead thanks to its outsize technology sector, European politicians are desperate to fight back in emerging industries such as green energy. One challenge they face is that America also keeps pulling ahead in the business of financing the investments required.

On Thursday, Luxembourg for Finance—a public-private partnership that seeks to promote the financial industry in the low-tax city state—published a report detailing the different ways in which European banks and asset managers might regain an edge relative to U.S. and Asian peers.

This is part of an effort by officials across the European Union to give firms a break. “Old economy” industries such as car manufacturing face rising competition from China and higher energy costs since Russia invaded Ukraine. The U.S. Inflation Reduction Act also has drawn investment across the Atlantic. Last year, the European Commission tasked former Italian prime ministers Mario Draghi and Enrico Letta with drafting a report on European competitiveness.

Luxembourg for Finance Chief Executive Nicolas Mackel echoes a common refrain: “Europe can take the lead in financial services when we eliminate fragmentation.” His report points out that the return on equity of European banks has bounced back in recent years. But it also showcases the gulf that has opened up relative to U.S. financial firms.

European lenders’ return on equity is now around 8%, compared with 12% across the Atlantic and 10% in Asia, in part as a result of stricter regulations following the 2008 banking crisis. Most European banks trade below book value on the stock market, having returned a negative 14% to investors since the April 2009 trough. Large American banks trade above book value and have gained 113%.

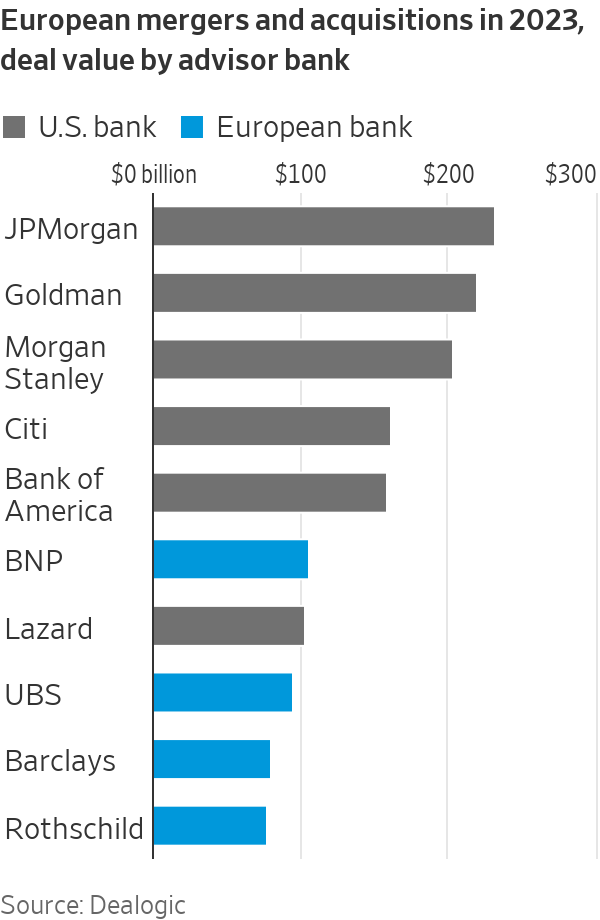
In services particularly exposed to international competition, American banks dominate in Europe too: In 2023, they took the top five positions for mergers and acquisitions deals, Dealogic data shows, with France’s BNP Paribas coming in sixth, and the top six spots for issuing equity.

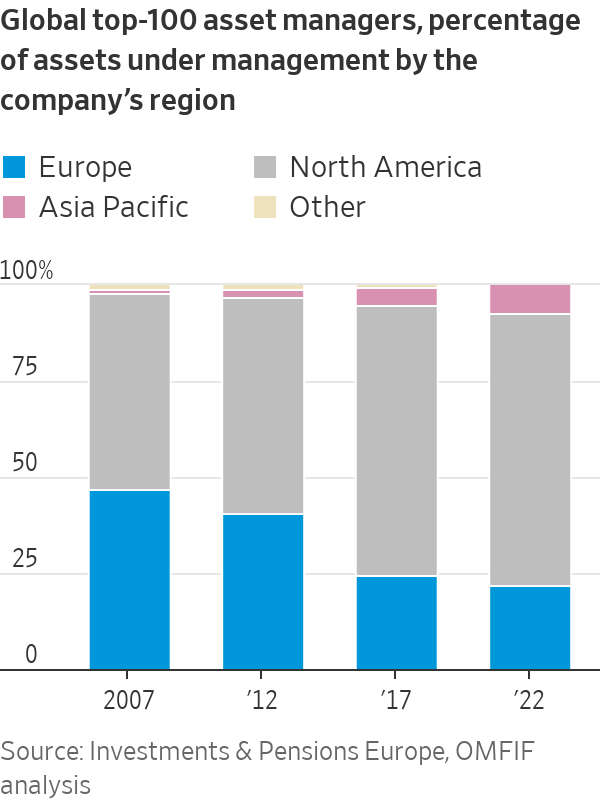
And this isn’t just about banks. In 2007, top European and U.S. asset managers roughly split the global market between them. By 2022, European fund managers had just 22% of total assets under supervision, with only France’s Amundi playing in the big leagues. This reflects their failure to jump on the train of low-fee passive investment as effectively as U.S. giants such as Vanguard and BlackRock. Ironically, the latter’s dominance in exchange-traded funds resulted from its acquisition of iShares from Britain’s Barclays in 2009.

European officials are taking some useful steps. They admitted in 2022 that a directive aimed at harmonising securities markets, known as Mifid 2, has done more harm than good, and have agreed to amend it. New EU-wide savings products give pensioners greater choice, and might help address the lack of sophistication that characterises European individual investors relative to Americans used to managing 401(k)s. Stringent constraints on what asset managers can offer are being relaxed, and the rules governing sustainable finance—where Europe has an edge—are being clarified.

Meanwhile, the fallout from last year’s Silicon Valley Bank debacle will bring U.S. regulation closer to Europe’s.

Such rule changes might narrow the gap, as investors have recognised: The stock-market discount at which European lenders trade compared with American ones has shrunk over the past three years. But it is hard to see the tables fundamentally turning. In the digital era, economies of scale are even more powerful. The European Union comprises many countries with different languages, whose firms and investors have local financial relationships and strong home biases. The obstacles to eliminating fragmentation are huge.

If Europe can’t compete with America’s private financial muscle, it is doubly problematic that its efforts to mobilize industrial investment through the public sector have been meek compared with the U.S. Inflation Reduction Act. Promoting more sustainability-minded funds isn’t an adequate fix.


MOST POPULAR
11 ACRES ROAD, KELLYVILLE, NSW

This stylish family home combines a classic palette and finishes with a flexible floorplan

35 North Street Windsor

Just 55 minutes from Sydney, make this your creative getaway located in the majestic Hawkesbury region.

Related Stories
Money
Impact Investing Is Turning Mainstream, Report Finds
By ABBY SCHULTZ 23/10/2024
Money
The cost of friendship: why Australian social circles are shrinking
By KANEBRIDGE NEWS 22/10/2024
Money
The Generosity Power Move That Can Boost Your Career
By RACHEL FEINTZEIG 22/10/2024
Impact Investing Is Turning Mainstream, Report Finds
By ABBY SCHULTZ
Wed, Oct 23, 2024 4 min

Impact investing is becoming more mainstream as larger, institutional asset owners drive more money into the sector, according to the nonprofit Global Impact Investing Network in New York.

In the GIIN’s State of the Market 2024 report, published late last month, researchers found that assets allocated to impact-investing strategies by repeat survey responders grew by a compound annual growth rate (CAGR) of 14% over the last five years.

These 71 responders to both the 2019 and 2024 surveys saw their total impact assets under management grow to US$249 billion this year from US$129 billion five years ago.

Medium- and large-size investors were largely responsible for the strong impact returns: Medium-size investors posted a median CAGR of 11% a year over the five-year period, and large-size investors posted a median CAGR of 14% a year.

Interestingly, the CAGR of assets held by small investors dropped by a median of 14% a year.

“When we drill down behind the compound annual growth of the assets that are being allocated to impact investing, it’s largely those larger investors that are actually driving it,” says Dean Hand, the GIIN’s chief research officer.

Overall, the GIIN surveyed 305 investors with a combined US$490 billion under management from 39 countries. Nearly three-quarters of the responders were investment managers, while 10% were foundations, and 3% were family offices. Development finance institutions, institutional asset owners, and companies represented most of the rest.

The majority of impact strategies are executed through private-equity, but public debt and equity have been the fastest-growing asset classes over the past five years, the report said. Public debt is growing at a CAGR of 32%, and public equity is growing at a CAGR of 19%. That compares to a CAGR of 17% for private equity and 7% for private debt.

According to the GIIN, the rise in public impact assets is being driven by larger investors, likely institutions.

Private equity has traditionally served as an ideal way to execute impact strategies, as it allows investors to select vehicles specifically designed to create a positive social or environmental impact by, for example, providing loans to smallholder farmers in Africa or by supporting fledging renewable energy technologies.

Future Returns: Preqin expects managers to rely on family offices, private banks, and individual investors for growth in the next six years

But today, institutional investors are looking across their portfolios—encompassing both private and public assets—to achieve their impact goals.

“Institutional asset owners are saying, ‘In the interests of our ultimate beneficiaries, we probably need to start driving these strategies across our assets,’” Hand says. Instead of carving out a dedicated impact strategy, these investors are taking “a holistic portfolio approach.”

An institutional manager may want to address issues such as climate change, healthcare costs, and local economic growth so it can support a better quality of life for its beneficiaries.

To achieve these goals, the manager could invest across a range of private debt, private equity, and real estate.

But the public markets offer opportunities, too. Using public debt, a manager could, for example, invest in green bonds, regional bank bonds, or healthcare social bonds. In public equity, it could invest in green-power storage technologies, minority-focused real-estate trusts, and in pharmaceutical and medical-care company stocks with the aim of influencing them to lower the costs of care, according to an example the GIIN lays out in a separate report on institutional  strategies.

Influencing companies to act in the best interests of society and the environment is increasingly being done through such shareholder advocacy, either directly through ownership in individual stocks or through fund vehicles.

“They’re trying to move their portfolio companies to actually solving some of the challenges that exist,” Hand says.

Although the rate of growth in public strategies for impact is brisk, among survey respondents investments in public debt totaled only 12% of assets and just 7% in public equity. Private equity, however, grabs 43% of these investors’ assets.

Within private equity, Hand also discerns more evidence of maturity in the impact sector. That’s because more impact-oriented asset owners invest in mature and growth-stage companies, which are favored by larger asset owners that have more substantial assets to put to work.

The GIIN State of the Market report also found that impact asset owners are largely happy with both the financial performance and impact results of their holdings.

About three-quarters of those surveyed were seeking risk-adjusted, market-rate returns, although foundations were an exception as 68% sought below-market returns, the report said. Overall, 86% reported their investments were performing in line or above their expectations—even when their targets were not met—and 90% said the same for their impact returns.

Private-equity posted the strongest results, returning 17% on average, although that was less than the 19% targeted return. By contrast, public equity returned 11%, above a 10% target.

The fact some asset classes over performed and others underperformed, shows that “normal economic forces are at play in the market,” Hand says.

Although investors are satisfied with their impact performance, they are still dealing with a fragmented approach for measuring it, the report said. “Despite this, over two-thirds of investors are incorporating impact criteria into their investment governance documents, signalling a significant shift toward formalising impact considerations in decision-making processes,” it said.

Also, more investors are getting third-party verification of their results, which strengthens their accountability in the market.

“The satisfaction with performance is nice to see,” Hand says. “But we do need to see more about what’s happening in terms of investors being able to actually track both the impact performance in real terms as well as the financial performance in real terms.”

MOST POPULAR
11 ACRES ROAD, KELLYVILLE, NSW

This stylish family home combines a classic palette and finishes with a flexible floorplan

35 North Street Windsor

Just 55 minutes from Sydney, make this your creative getaway located in the majestic Hawkesbury region.

Related Stories
Lifestyle
Celebrations Big and Small Are Getting Longer and More Extravagant for the Rich
By SHIVANI VORA 21/06/2024
Money
Let’s ‘Double-Click’ on the Latest Cringeworthy Corporate Buzzword
By TE-PING CHEN 11/07/2024
Money
RBA Board keeps interest rates on hold again as high inflation digs in
By KANEBRIDGE NEWS 06/08/2024
0
    Your Cart
    Your cart is emptyReturn to Shop