Art Market Dip Last Year Reflects Lack of Supply, Not Demand

 3 min
3 min
The global market for art may have been softer last year against a more volatile economic backdrop, but trends detailed within the latest annual report from Art Basel and UBS released earlier this week continue to show collectors are willing to buy.
Scanning a chart within the report of sales since 2009 reveals an ebb-and-flow in the overall market, but surprising consistency in the value of transactions and an uptick in volume.
The year-to-year differences, such as the 4% dip in market value to US$65 billion last year, are mostly driven by the number and outcome of big-ticket sales, which declined across auction houses and galleries in 2023.
How many high-value works of art come to market in a given year, however, often has less to do with buying interest from collectors during shaky economic conditions and more to do with the willingness of sellers to part with paintings or sculptures during a time of perceived weakness, according to Matthew Newton, art advisory specialist at UBS Family Office Solutions in New York.
“I don’t think we see an unwillingness to buy those works when they do come to market,” Newton says.
When the economy is weak, estates with less discretion over timing often are the main consignors of expensive art. For example, last fall in New York, Sotheby’s sold works owned by Emily Fisher Landau , a long-time patron who amassed a collection bursting with masterpieces that hadn’t appeared at an auction before.
Sotheby’s single-owner auction of the Fisher Landau collection led to the US$139.4 million sale of Pablo Picasso’s Femme à la montre (the second highest price for a Picasso work at auction); the US$41 million sale of Jasper Johns’ Flags ; and the record US$18.7 million sale of Agenes Martin’s Grey Stone II —prices that were within or exceeded expectations.
“People are still willing to make trophy purchases,” Newton says. “I don’t think there’s a lack of demand, it’s about a lack of supply.”
Rising interest rates since 2022 arguably could be another factor in slower high-end sales, since wealthy individuals finance about 29% of their art collections, on average, while the ultra-wealthy (those with a net worth above US$50 million) finance as much as 39%, according to a separate report on global collecting trends published late last year from Art Basel and UBS.
But Newton doesn’t believe higher rates played a significant role in the art market last year. The wealthy typically borrow money for business or investment opportunities; if they have a US$500 million art collection on their walls, borrowing against it can be a good source of liquidity. Any impact it has on the market would be “within the margin of error,” Newton says.
Another chart in the report tracks sales growth from 2009 through 2023 in five segments of the auction market, from works sold below US$50,000 to those achieving US$10 million or more. The results show the performance of most works of art that are sold—that is, those that fall below the US$10 million level—has been “relatively flat over a decade plus,” Newton says. “It’s really those works that are over US$10 million … that’s where we see growth in the art market.”
At auction, the US$10 million-plus segment fell a substantial 25% in 2023 from the previous year, but overall, the sales trend for those ultra-expensive paintings since 2009 has been on an upward trajectory. That’s no accident, considering the population of billionaires who fuel those sales has also continued to rise, with their wealth doubling over the last 10 years to about US$13.1 billion, according to the report.
“It’s a relatively very small group of people who can spend over US$10 million on artwork,” Newton says. Of those who can afford to, not everyone does, meaning a few individuals can alter total sales for the whole market.
In part, that’s because global art sales are relatively small even at US$65 billion. Consider the global private-equity market—another place where the wealthiest individuals place their money—was estimated to reach US$16.3 trillion last year, according to London data firm Preqin.
“$65 billion … that’s obviously a lot of money,” he says. “On the other hand, that’s the entire art market—it’s like less than half the net worth of a few individuals.”
Newton says he often reminds clients that not that much art that exists in the world is sold. “What is traded is a very, very small percentage of the work that’s out there.”
 Copyright 2020, Dow Jones & Company, Inc. All Rights Reserved Worldwide. LEARN MORE


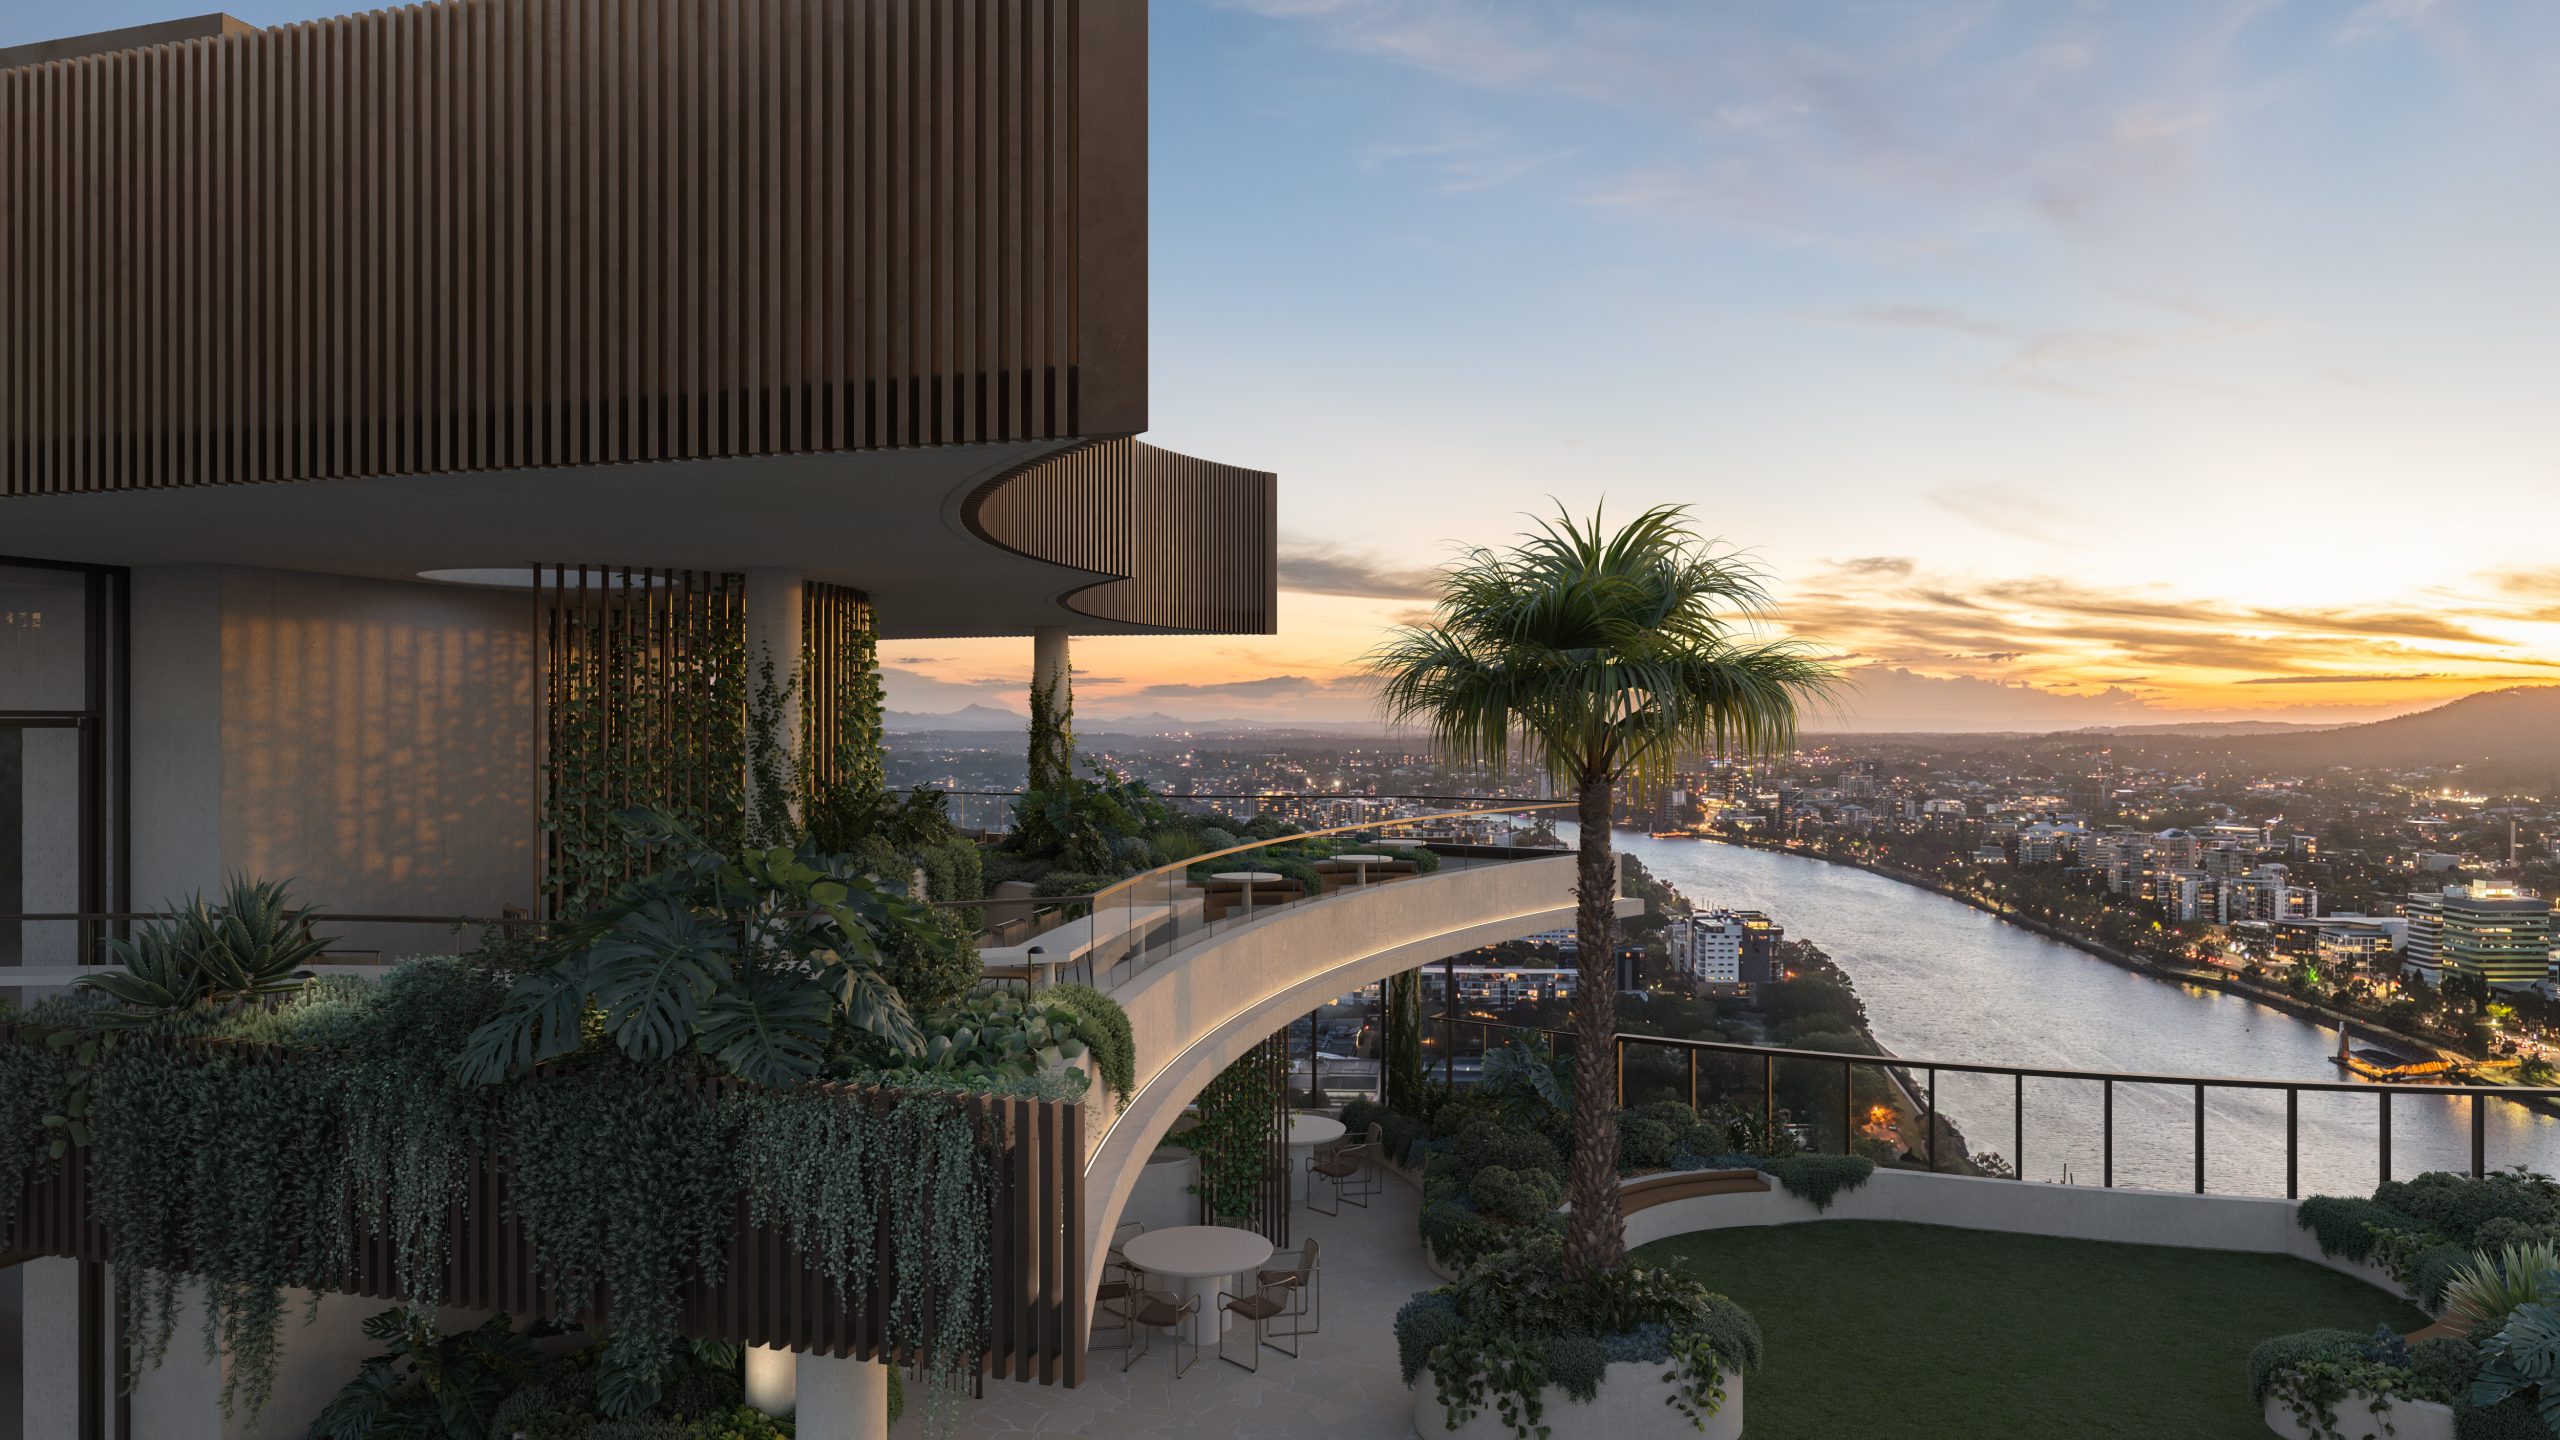
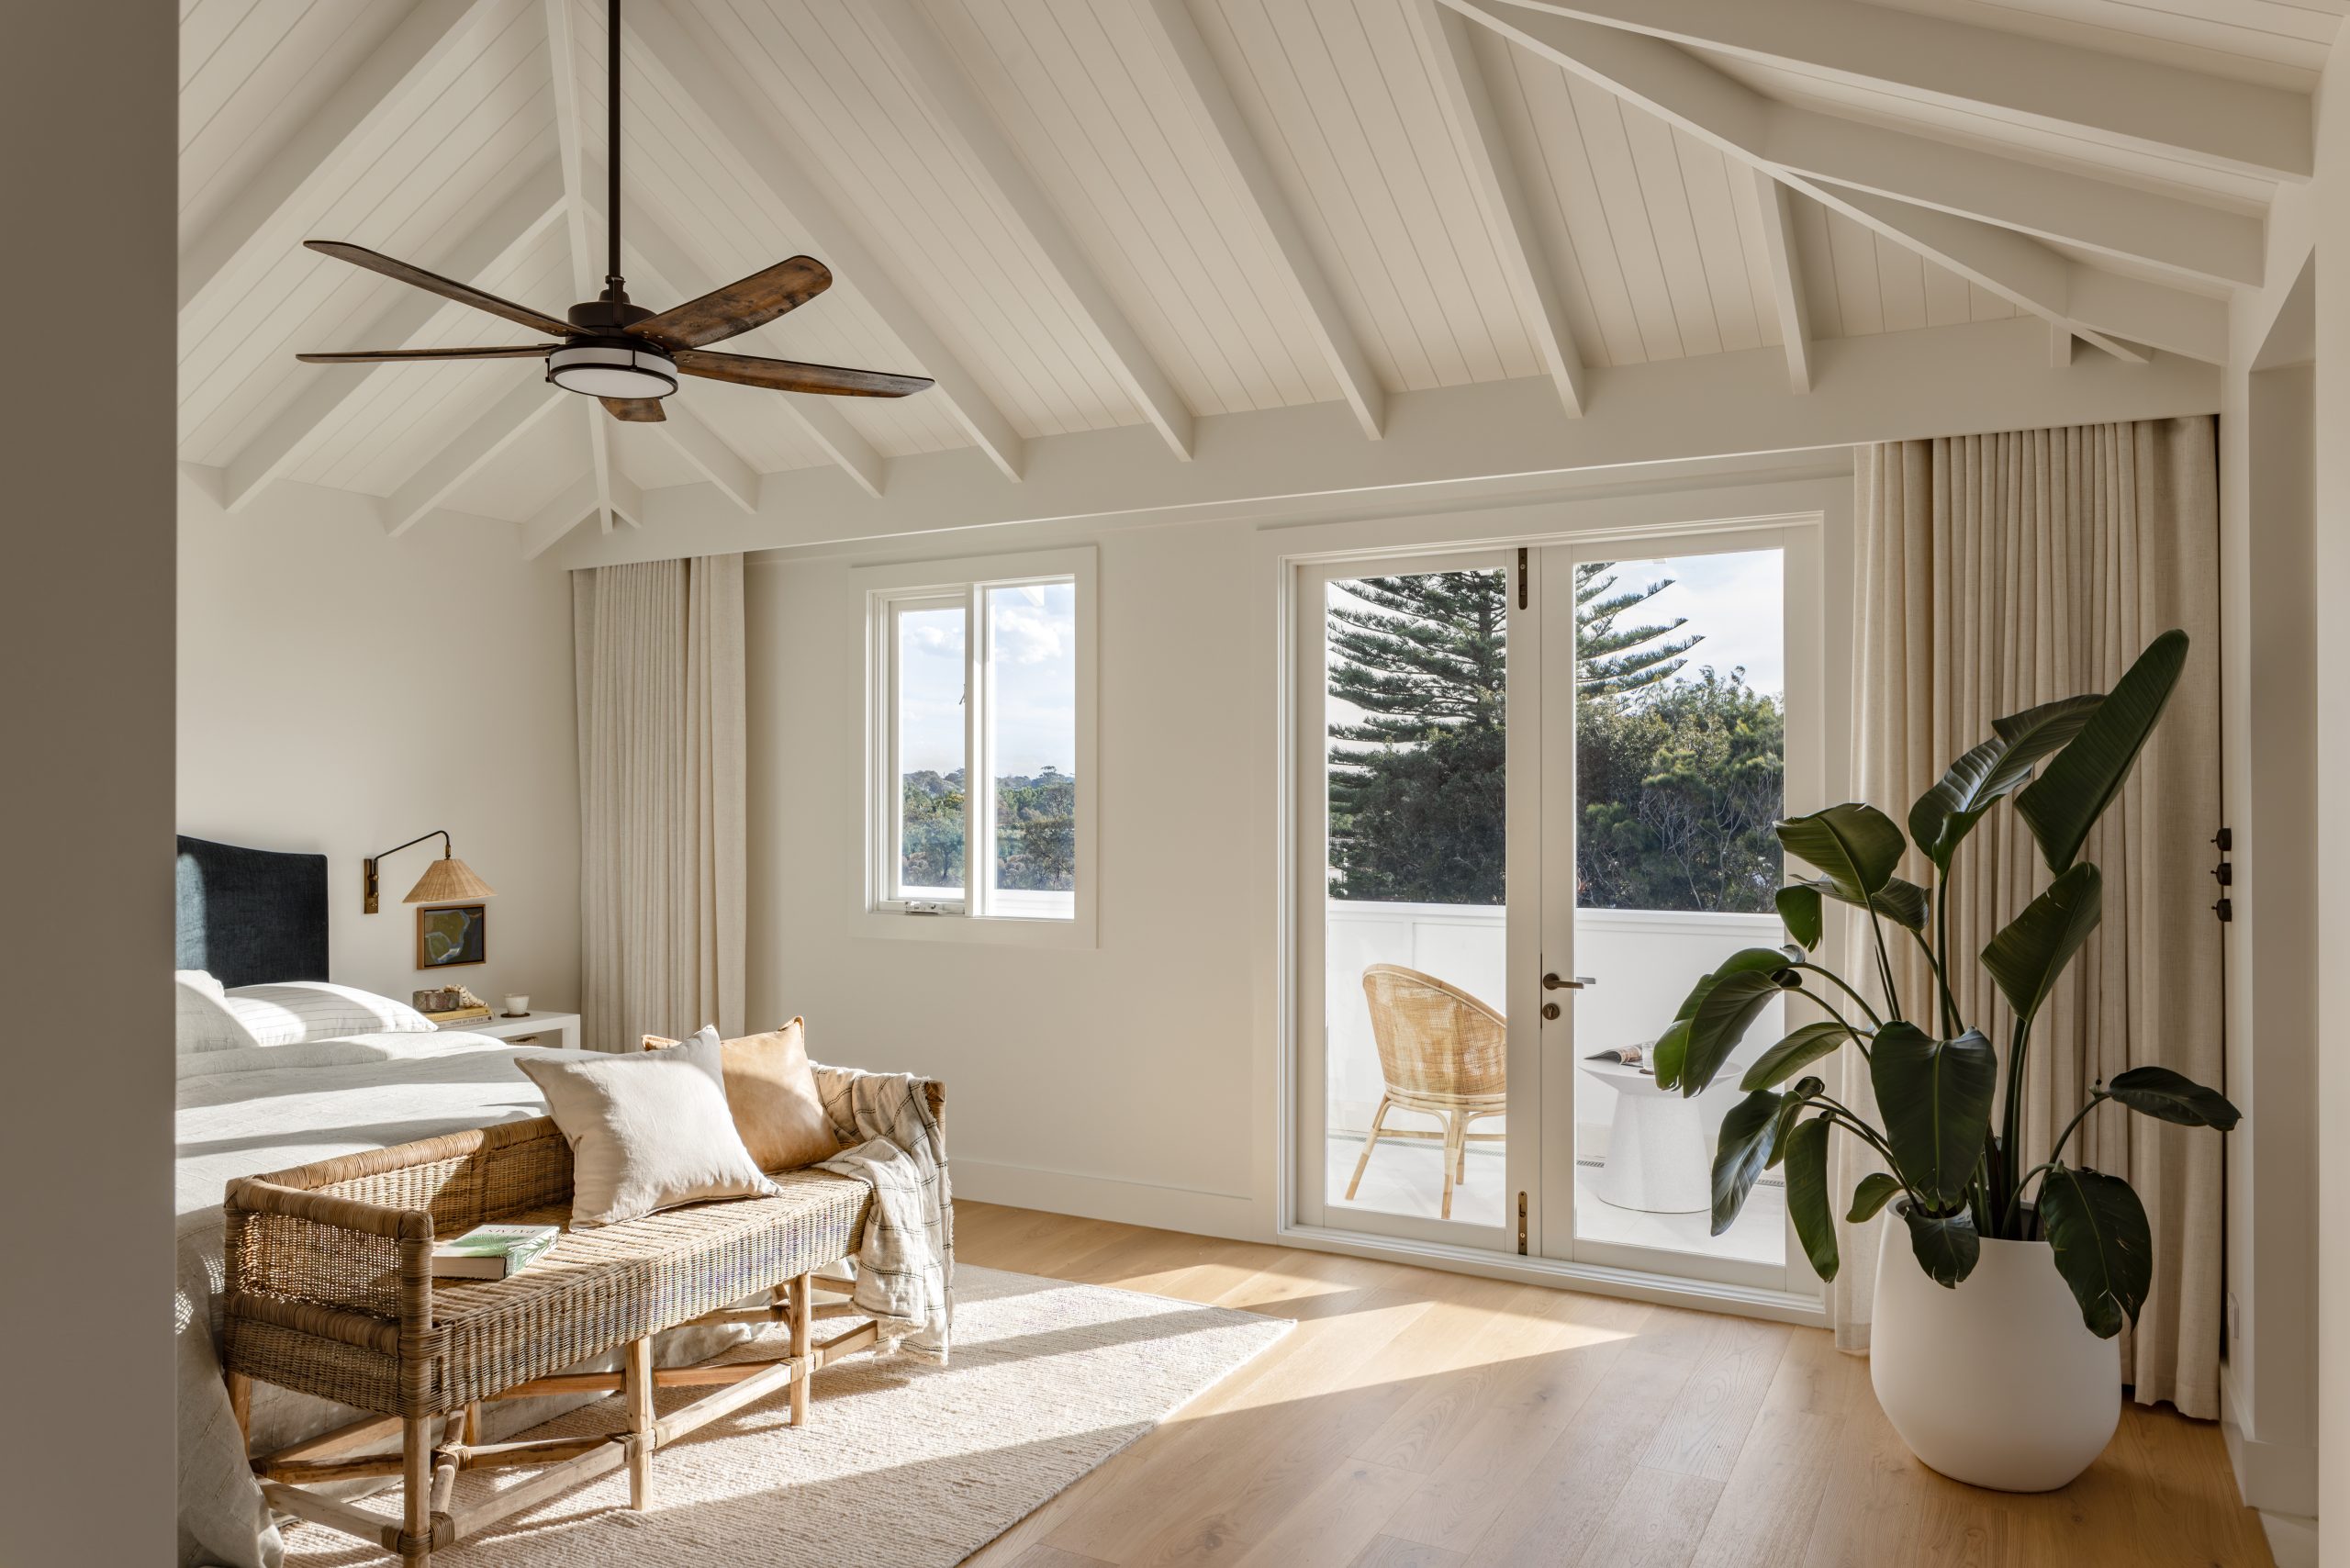
Set on one of the city’s last absolute riverfront sites, The Riversdale by Mosaic combines irreplaceable waterfront ownership with one of Brisbane’s most significant residential opportunities.
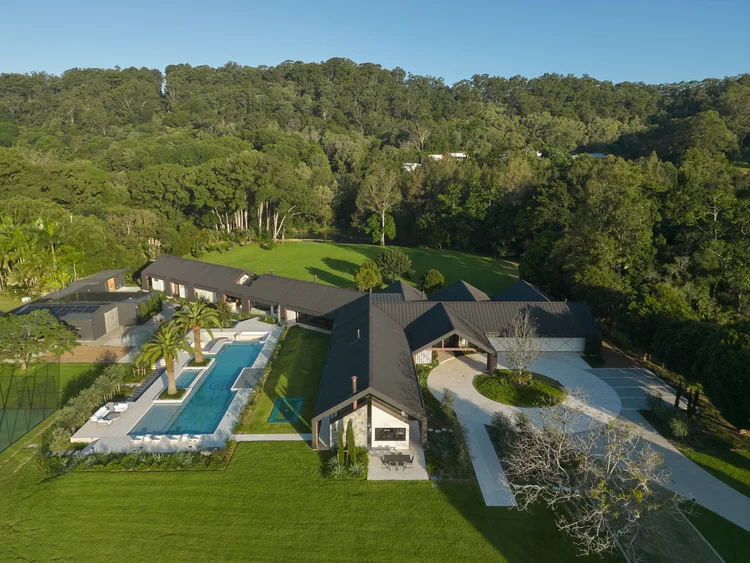
Margot Robbie may have travelled from a Queensland farm to the highest reaches of Hollywood, but a reported $28 million property deal suggests the Gold Coast has never lost its hold on her. The Australian actor and producer is believed to be the mystery buyer of Redwood, a seven-acre Currumbin Valley estate transformed into the …
Continue reading “Margot Robbie Reportedly Behind $28 Million Currumbin Valley Homecoming”
The federal budget has rattled property investors. But the biggest mistake isn’t the tax changes, it’s the conclusion many are drawing from them.
2 min
The recent budget has forced a reckoning for property investors.
Negative gearing now restricted to new residential builds, the CGT discount gone and on paper, the numbers look different.
And many investors are responding by pivoting toward yield, prioritising cash flow over capital growth in a way that property strategists say misses the point entirely.
“The debate has shifted to yield versus growth as if they are opposing forces,” says Abdullah Nouh, founder of Melbourne-based buyers’ agency Mecca Property Group. “But that framing is itself the mistake.”
Nouh, who works with high-net-worth families and investors on long-term acquisition strategy, argues that capital growth remains the primary driver of genuine wealth creation and that the post-budget environment has made quality assets more important, not less.
The numbers make his case plainly. An additional $500 per week in rental income is welcome. A prestige asset appreciating by $1 million over a market cycle is transformative.
These are not equivalent outcomes, and portfolios built around yield at the expense of location and land value tend to generate income while wealth stands largely still.
The more nuanced shift Nouh is seeing among sophisticated investors is a move toward assets where both outcomes can be engineered simultaneously – established homes on substantial land in quality locations, where the existing dwelling can be repositioned, rental returns improved, and the underlying land value compounds independent of what sits on it.
For investors with existing equity, commercial property is also entering the conversation in a more serious way.
Prestige industrial assets, medical centres and long-leased essential retail offer income profiles that residential property in most capital city markets cannot currently match: longer lease terms, tenants covering outgoings, and greater predictability than the residential tenancy cycle.
“The investors who build lasting wealth are rarely the ones who chased yield or growth exclusively,” says Nouh.
“They are the ones who built a strategy they could sustain – one that generated enough income to hold quality assets through multiple cycles while those assets compounded in value.”
The budget has changed the settings. It has not changed the fundamentals.

Margot Robbie and Jacob Elordi star in an adaptation of the classic novel that respects the romance’s slow burn.

Hand-built in Melbourne and limited to just 10 cars a year, the Zeigler/Bailey Z/B 4.4 is reshaping what a modern collector car can be.