As Greedflation Starts to Fade, Wageflation Creeps In
Softer demand, more supply and rising labor costs all take the air out of profit margins

 4 min
4 min
When inflation took off in 2021 in the U.S., so did corporate profits, leading to accusations of “greedflation” and calls in some corners for price controls. This year, Europe is going through the same debate amid soaring food prices.
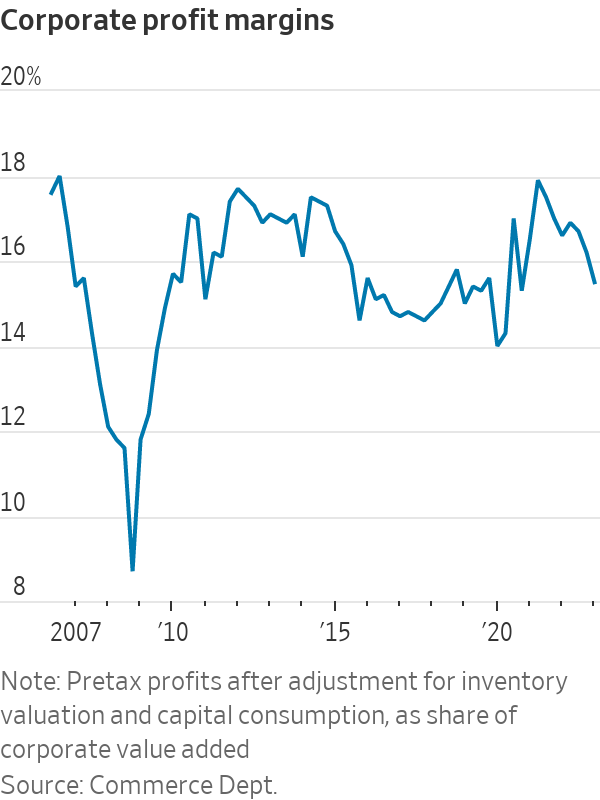
Judging by recent developments, inflation driven by corporations flexing their power to jack up prices more than costs—greedflation, as some called it—is on its way out. Pretax margins, which widened sharply in 2021 and 2022, were roughly back to pre pandemic levels in the first quarter of 2023, according to revised government data released last week. Margins in six of the S&P 500’s 11 sectors were lower in the second quarter than four years earlier, according to FactSet.
Narrowing profit margins, though, doesn’t necessarily mean an end to inflation. Wages are now growing faster than prices. While that doesn’t provoke the same outrage as soaring profits, it’s just as problematic for getting inflation down.
The circumstances of 2021 and 2022 made for a seller’s paradise. As the economy reopened, newly vaccinated consumers rushed to spend pent-up savings and stimulus cash. That demand collided with supply held down by pandemic disruptions and the inability of meeting so much demand with existing capacity.
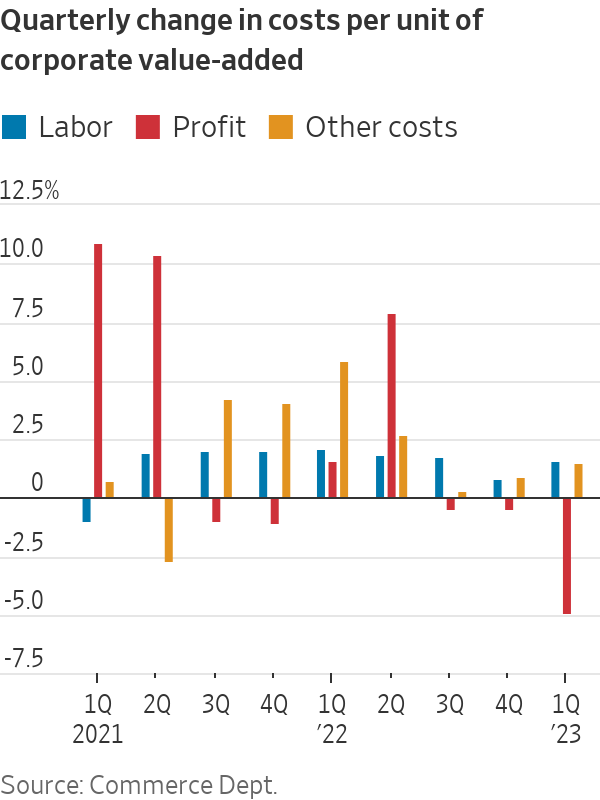
The result: pretax margins shot from 15.6% in the fourth quarter of 2019 to 17.9% in the second quarter of 2021. That’s based on the Commerce Department’s measure of total value added by corporate businesses. This measure separates total costs into labor, profits, and non labour costs such as depreciation, interest and excise taxes, while excluding inputs, such as energy.
In the year through the second quarter of 2021, those companies’ prices rose 4.3%. At the same time, the cost of labour per unit of output fell 2.3%, because though wages were rising in that time, output per worker (productivity) was rising faster. Profit per unit of output rose a whopping 40%.
Greedflation is a catchy phrase, but not of much analytical value. Businesses always set prices to maximise profits. Raising them too much risks competitors ramping up supply to take market share.
But in 2021 and most of 2022 many companies couldn’t expand supply because of shortages of materials, labour or transport capacity. In the past when demand for vehicles rose, manufacturers effortlessly boosted output. This time, a shortage of semiconductors curtailed production and manufacturers responded to strong demand by slashing incentives and raising prices. General Motors sold fewer vehicles in both 2021 and 2022 than in 2019 but in both years made about 50% more profit. Companies weren’t the only beneficiaries: so was anyone with a used car to sell.
While greed is timeless, companies conceivably may have more power to translate greed into prices because of declining competition. The Biden administration, for example, blamed soaring meat prices in part on consolidation among meatpackers. But that wouldn’t have translated into such high prices without so much demand from locked-down consumers and the industry enduring production interruptions and labour shortages due to Covid-19, drought, avian flu and shrunken herds.
In recent quarters demand has softened. Adjusted for inflation, consumer spending was flat in three of the past four months. Tyson Foods lost money in the second quarter as soft demand pulled down prices for pork and beef while feed and labour expenses rose.
Supply, meanwhile, seems to be improving, at least for goods. In a report this week, economists at Goldman Sachs said global shipments of automotive semiconductor chips and U.S. auto production in the past few months are finally above pre pandemic levels. As a result, automotive inventories and incentives are both on the rise. In May the average new car buyer paid $410 below sticker price, compared with $637 above a year earlier, according to Cox Automotive.
Demand for services is holding up better than for goods, and services supply is still constrained, in particular by labour shortages. One reason air travel is so expensive is that airline capacity this year is about 14% below pre pandemic trend levels, Delta Air Lines recently told shareholders.
As airlines add flights they stretch staff, aircraft and air-traffic controllers to capacity, leaving them vulnerable to the slightest disruption. After thunderstorms triggered hundreds of flight cancellations in recent weeks, United Airlines said it might reduce flights out of its Newark, N.J. hub to create a buffer.
Airlines also reflect a broader reality: Whatever pricing power business still commands is increasingly eaten up by labor costs. Pilot shortages caused by pandemic retirements have given unions bargaining leverage, with many seeking to replicate a 34%, four-year increase Delta gave its pilots this year.
Workers are slowly recapturing more of the economic pie. In the first quarter of 2023, wages and salaries rose to 49.3% of corporate value added, higher than in 2019. Labor costs per unit of sales rose 6% in the year through the first quarter, ahead of prices, which were up 5.3% in the same period. Profits per unit of output rose just 1.6%.
The trend of wages rising faster than prices has continued in recent months. That’s welcome relief for workers but poses a set of difficult tradeoffs: Either profit margins will have to narrow further, which businesses will resist; high inflation will have to continue, which the Federal Reserve is fighting; or productivity will have to boom, of which there is no sign yet. If none of those things happen, then wageflation, like greedflation, will have to go away.
 Copyright 2020, Dow Jones & Company, Inc. All Rights Reserved Worldwide. LEARN MORE


This stylish family home combines a classic palette and finishes with a flexible floorplan

Just 55 minutes from Sydney, make this your creative getaway located in the majestic Hawkesbury region.
When will Berkshire Hathaway stop selling Bank of America stock?
3 minBerkshire began liquidating its big stake in the banking company in mid-July—and has already unloaded about 15% of its interest. The selling has been fairly aggressive and has totaled about $6 billion. (Berkshire still holds 883 million shares, an 11.3% interest worth $35 billion based on its most recent filing on Aug. 30.)
The selling has prompted speculation about when CEO Warren Buffett, who oversees Berkshire’s $300 billion equity portfolio, will stop. The sales have depressed Bank of America stock, which has underperformed peers since Berkshire began its sell program. The stock closed down 0.9% Thursday at $40.14.
It’s possible that Berkshire will stop selling when the stake drops to 700 million shares. Taxes and history would be the reasons why.
Berkshire accumulated its Bank of America stake in two stages—and at vastly different prices. Berkshire’s initial stake came in 2017 , when it swapped $5 billion of Bank of America preferred stock for 700 million shares of common stock via warrants it received as part of the original preferred investment in 2011.
Berkshire got a sweet deal in that 2011 transaction. At the time, Bank of America was looking for a Buffett imprimatur—and the bank’s stock price was weak and under $10 a share.
Berkshire paid about $7 a share for that initial stake of 700 million common shares. The rest of the Berkshire stake, more than 300 million shares, was mostly purchased in 2018 at around $30 a share.
With Bank of America stock currently trading around $40, Berkshire faces a high tax burden from selling shares from the original stake of 700 million shares, given the low cost basis, and a much lighter tax hit from unloading the rest. Berkshire is subject to corporate taxes—an estimated 25% including local taxes—on gains on any sales of stock. The tax bite is stark.
Berkshire might own $2 to $3 a share in taxes on sales of high-cost stock and $8 a share on low-cost stock purchased for $7 a share.
New York tax expert Robert Willens says corporations, like individuals, can specify the particular lots when they sell stock with multiple cost levels.
“If stock is held in the custody of a broker, an adequate identification is made if the taxpayer specifies to the broker having custody of the stock the particular stock to be sold and, within a reasonable time thereafter, confirmation of such specification is set forth in a written document from the broker,” Willens told Barron’s in an email.
He assumes that Berkshire will identify the high-cost Bank of America stock for the recent sales to minimize its tax liability.
If sellers don’t specify, they generally are subject to “first in, first out,” or FIFO, accounting, meaning that the stock bought first would be subject to any tax on gains.
Buffett tends to be tax-averse—and that may prompt him to keep the original stake of 700 million shares. He could also mull any loyalty he may feel toward Bank of America CEO Brian Moynihan , whom Buffett has praised in the past.
Another reason for Berkshire to hold Bank of America is that it’s the company’s only big equity holding among traditional banks after selling shares of U.S. Bancorp , Bank of New York Mellon , JPMorgan Chase , and Wells Fargo in recent years.
Buffett, however, often eliminates stock holdings after he begins selling them down, as he did with the other bank stocks. Berkshire does retain a smaller stake of about $3 billion in Citigroup.
There could be a new filing on sales of Bank of America stock by Berkshire on Thursday evening. It has been three business days since the last one.
Berkshire must file within two business days of any sales of Bank of America stock since it owns more than 10%. The conglomerate will need to get its stake under about 777 million shares, about 100 million below the current level, before it can avoid the two-day filing rule.
It should be said that taxes haven’t deterred Buffett from selling over half of Berkshire’s stake in Apple this year—an estimated $85 billion or more of stock. Barron’s has estimated that Berkshire may owe $15 billion on the bulk of the sales that occurred in the second quarter.
Berkshire now holds 400 million shares of Apple and Barron’s has argued that Buffett may be finished reducing the Apple stake at that round number, which is the same number of shares that Berkshire has held in Coca-Cola for more than two decades.
Buffett may like round numbers—and 700 million could be just the right figure for Bank of America.
This stylish family home combines a classic palette and finishes with a flexible floorplan
Just 55 minutes from Sydney, make this your creative getaway located in the majestic Hawkesbury region.