Australia Is The Lucky Country
Certainly when backed by the property market – but what of risk and the shadow of rumoured rate rises?
 4 min
4 min
OPINION
The end of financial year normally marks an annual ritual of self-assessment.
Which really means a financial appraisal of one’s investment portfolio performance relative to the market, as well as creating financial goals for the next 12 months.
A key takeaway from living through the extraordinary circumstances due to Covid-19 is, of course, to expect the unexpected.
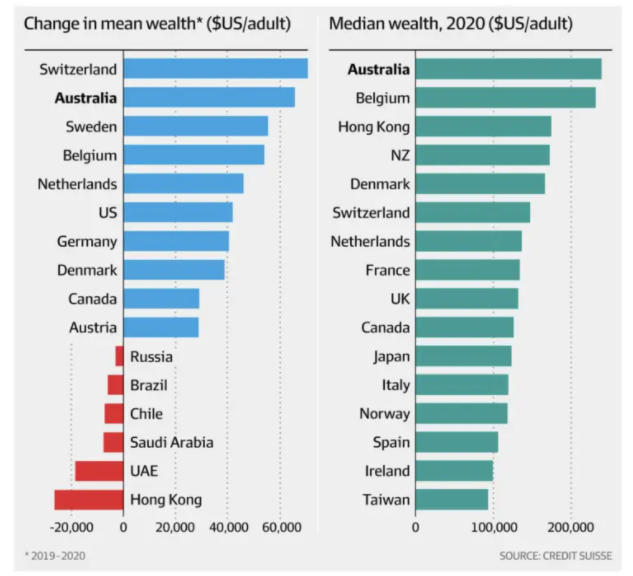
According to Credit Suisse, Australians have become financially the wealthiest people in the world. This has been driven by the ongoing performance of our two principal sources of wealth – housing and financial assets, underpinned by robust GDP growth.
With record-low interest rates, asset prices have essentially experienced a boom — house prices being the largest contributing factor by adding an extra 7 trillion dollars to Austraila’s net wealth.
Whilst still within the epicentre of the pandemic, Australia has performed remarkably well, notwithstanding international border closures and associated lack of tourism and international students.
Remarkably, the construction industry and certain property types, such as units, have not faltered despite limited international immigration and a substantial exodus of temporary residents from Australia.
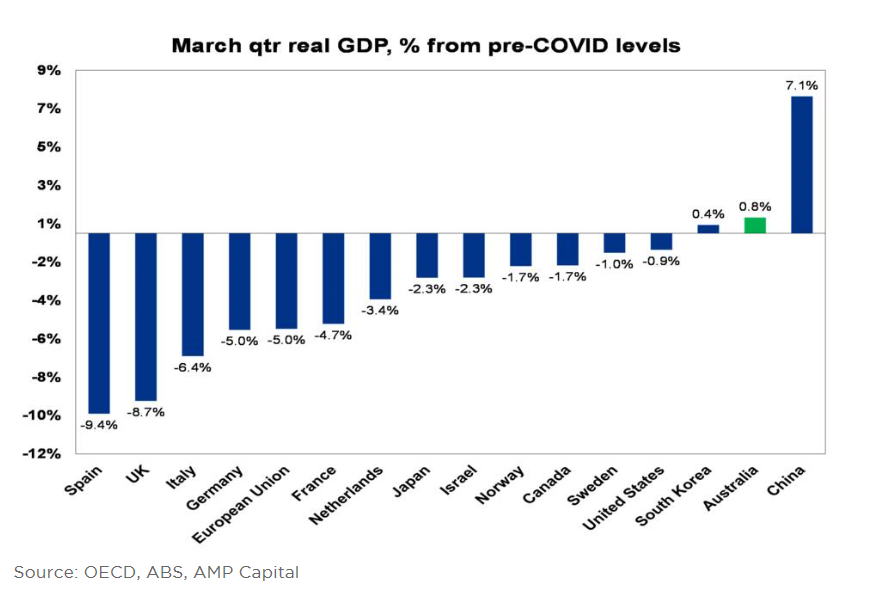
In fact, due to record iron ore prices and an increase in demand for mining products in combination with an elevated Australian dollar, we are one of only three countries in the world with GDP now higher than pre-pandemic levels. Again, Australians have collectively fared much better compared to the rest of world.
As a result, the extraordinary V shape recovery is placing pressure on supply chain constraints and the combination of labour shortages resulting in ‘inflation bells’ sounding the alarm.
In line with my last article, inflation confidence, the current debate over inflation is becoming the number one “hot” economic topic, as the risk to the economy and its stability is based on interest rates remaining low in the medium term.
We are presently operating under the Reserve Bank’s proclamation that interest rates will remain unchanged until 2023. Ultimately, interest rates may need to rise earlier to combat inflation if required. This will inevitably deflate most asset classes modestly at best, or, at worst, will result in a crash and economic recession. As the market grapples with the two opposing views on whether inflation is transitionary or not, we should anticipate more volatility and heated debate on this topic.
It is Msquared’s view that inflation is indeed transitionary and that the government will intervene in the investment property market if or when required to ensure the market does not overheat.
We believe that if the government is unable to open international borders at the end of the year — and manage the vaccination rollout more effectively — there is a real risk and impact to both economic fundamentals and our overall business consumer confidence.
In considering the current economic environment and the uncertainty created by Covid-19. How can investors continue investing with confidence?
The collective wisdom of the greatest and most successful investor’s such as Warren Buffet, Jack Bogle, George Soros and Ray Dalio, just to name a few, put it down to a simple formula of the following:
- Understanding risk.
- Diversification across asset classes.
- Ensuring that you are constantly invested in the market irrespective of the current market cycles.
Put simply, the understanding of risk is the appreciation of the loss of capital relative to the reward. Most investors’ attention is drawn to the promises of return rather than an assessment of any downside risk, such as the possibility of losing capital.
Ultimately, once an investor experiences capital losses one of two behaviours emerges:
- The fear of investing
- Taking an even greater risk on future investments in an attempt to recoup the loss.
Either strategy is essentially a disaster long-term.
Understanding and appreciating risk is a learnt skill and you can now tap into the acquired knowledge which suggests:
- To pause the temptation of trying to predict the market.
- Not to follow fads and trends.
- Not be swept up in the emotion of the moment.
As a result, we are experiencing structural changes to the investment market, there is excess capital and higher asset prices result in yield compression across all the markets. Demand for mortgages and alternative investment has never been higher. Investors are seeking higher returns due to favourable economic market conditions with disregard to the higher risks, which is a clear danger to investors if not managed appropriately.
Paul Miron has more than 20 years experience in banking and commercial finance. After rising to senior positions for various Big Four banks, he started his own financial services business in 2004.


This stylish family home combines a classic palette and finishes with a flexible floorplan

Just 55 minutes from Sydney, make this your creative getaway located in the majestic Hawkesbury region.


Continued stagflation and cost of living pressures are causing couples to think twice about starting a family, new data has revealed, with long term impacts expected
2 min
Australia is in the midst of a ‘baby recession’ with preliminary estimates showing the number of births in 2023 fell by more than four percent to the lowest level since 2006, according to KPMG. The consultancy firm says this reflects the impact of cost-of-living pressures on the feasibility of younger Australians starting a family.
KPMG estimates that 289,100 babies were born in 2023. This compares to 300,684 babies in 2022 and 309,996 in 2021, according to the Australian Bureau of Statistics (ABS). KPMG urban economist Terry Rawnsley said weak economic growth often leads to a reduced number of births. In 2023, ABS data shows gross domestic product (GDP) fell to 1.5 percent. Despite the population growing by 2.5 percent in 2023, GDP on a per capita basis went into negative territory, down one percent over the 12 months.
“Birth rates provide insight into long-term population growth as well as the current confidence of Australian families,” said Mr Rawnsley. “We haven’t seen such a sharp drop in births in Australia since the period of economic stagflation in the 1970s, which coincided with the initial widespread adoption of the contraceptive pill.”
Mr Rawnsley said many Australian couples delayed starting a family while the pandemic played out in 2020. The number of births fell from 305,832 in 2019 to 294,369 in 2020. Then in 2021, strong employment and vast amounts of stimulus money, along with high household savings due to lockdowns, gave couples better financial means to have a baby. This led to a rebound in births.
However, the re-opening of the global economy in 2022 led to soaring inflation. By the start of 2023, the Australian consumer price index (CPI) had risen to its highest level since 1990 at 7.8 percent per annum. By that stage, the Reserve Bank had already commenced an aggressive rate-hiking strategy to fight inflation and had raised the cash rate every month between May and December 2022.
Five more rate hikes during 2023 put further pressure on couples with mortgages and put the brakes on family formation. “This combination of the pandemic and rapid economic changes explains the spike and subsequent sharp decline in birth rates we have observed over the past four years,” Mr Rawnsley said.
The impact of high costs of living on couples’ decision to have a baby is highlighted in births data for the capital cities. KPMG estimates there were 60,860 births in Sydney in 2023, down 8.6 percent from 2019. There were 56,270 births in Melbourne, down 7.3 percent. In Perth, there were 25,020 births, down 6 percent, while in Brisbane there were 30,250 births, down 4.3 percent. Canberra was the only capital city where there was no fall in the number of births in 2023 compared to 2019.
“CPI growth in Canberra has been slightly subdued compared to that in other major cities, and the economic outlook has remained strong,” Mr Rawnsley said. “This means families have not been hurting as much as those in other capital cities, and in turn, we’ve seen a stabilisation of births in the ACT.”
This stylish family home combines a classic palette and finishes with a flexible floorplan
Just 55 minutes from Sydney, make this your creative getaway located in the majestic Hawkesbury region.