Barron’s 100 Most Sustainable Companies
Many companies would love a break on labor, after a year of strife when workers from Hollywood to Detroit flexed their muscle. It may be wishful thinking to expect a reprieve.
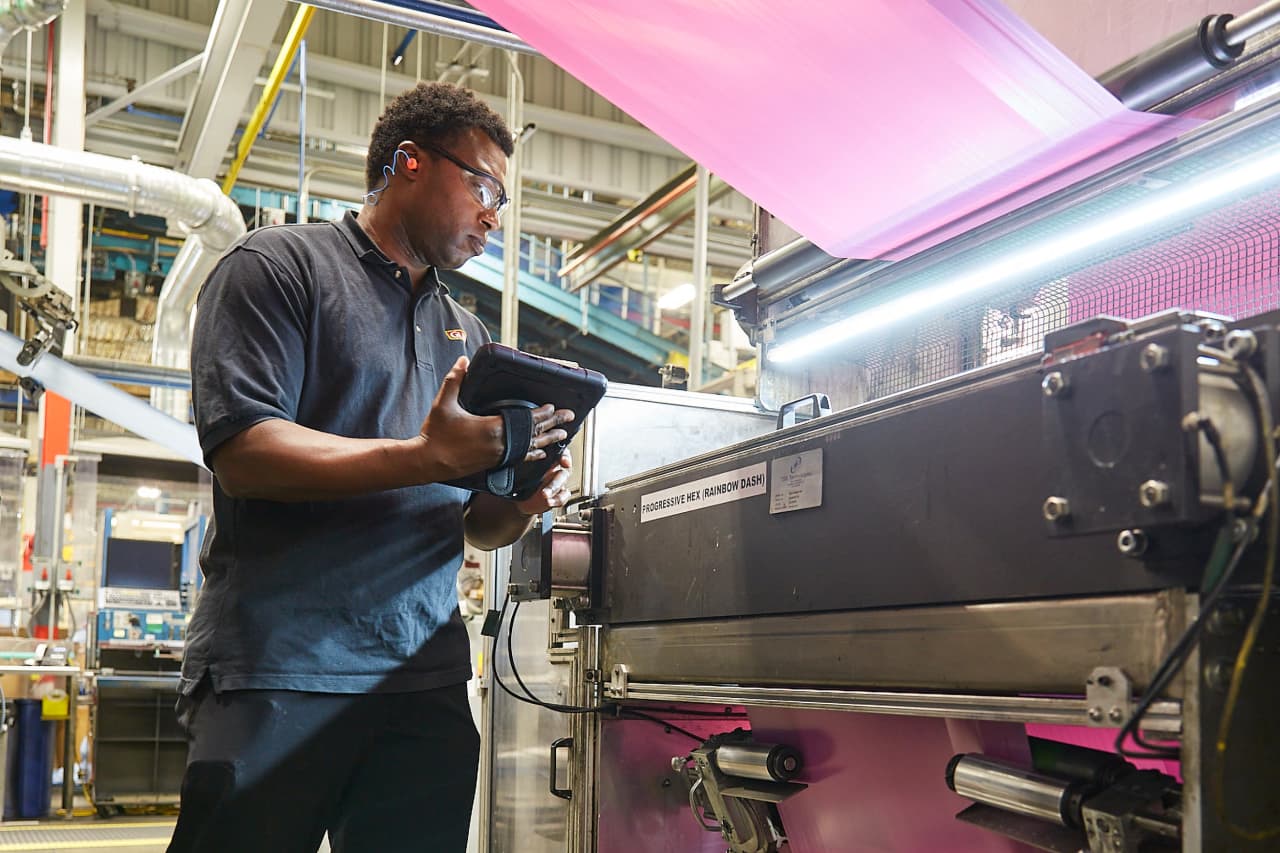
A resilient economy isn’t likely to shift leverage from workers to corporate bosses. Despite pockets of layoffs, namely in technology, the job market remains tight, with unemployment near record lows. A backlash against “diversity, equity, and inclusion” initiatives, or DEI, is jumping from colleges to companies— Alphabet and Meta Platforms have reportedly pulled back, for instance. Throw in a virtual lockdown on immigration, combined with a spike in U.S. manufacturing, and many companies may have another rough year of labor challenges.
Some companies are navigating these issues better than others—finding ways to reward workers and meet DEI goals without taking big hits to their profits or reputations for social responsibility. Several of those faring well made it into Barron’s ranking of the 100 most sustainable companies .
To make the list, our seventh annual ranking, companies were scored on a variety of environmental, social, and governance, or ESG, measures. Barron’s worked with Calvert Research and Management, a leader in responsible investing, to rank the companies. The top 100 firms—winnowed from the largest 1,000 publicly traded U.S. companies—achieved the highest scores across 230 ESG metrics, from workplace diversity to greenhouse-gas emissions. (See below for the complete list and more about the methodology.)
Home-products company Clorox sits at the top of the leader board for the second straight year, edging out Kimberly-Clark , CBRE Group , Hasbro , and Agilent Technologies in the top five. The overall lineup spans a wide range of industries, with tech, industrials, and consumer companies all well represented.
Many of the companies delivered solid results for shareholders. The top 100 returned an average 19% in 2023, versus 26%, including dividends, for the S&P 500 index. That doesn’t look great. But the S&P 500 is weighted by market capitalisation and last year’s “Magnificent Seven”— Apple , Microsoft , Amazon.com , Nvidia , Meta Platforms, Tesla , and Alphabet—fuelled almost all the market’s gains. Strip away that influence, and the equal-weighted S&P 500 returned 14%, trailing the 100 most sustainable companies.
Several stocks delivered standout returns in 2023, led by chip maker Nvidia, ranked 41st with a 239% gain. Other tech winners included HubSpot , Intel , Applied Materials , and Lam Research . Strong performers in other industries were Trex , Lennox International , Williams-Sonoma , Insight Enterprises , and Owens Corning .
A big theme in this year’s rankings was progress on corporate governance and labor relations, says Chris Madden, a managing director at Calvert, which is owned by Morgan Stanley Investment Management. “A lot of the companies on this list have done a stellar job dealing with employees,” he says.
Strikes were big in 2023 as Hollywood screenwriters and Detroit auto workers took to the picket lines, winning concessions and pay raises. Pilots and other unionised groups fared well, breathing life back into the organised labour movement, which had been in decline since the 1950s. New technologies such as artificial intelligence and electric vehicles are upending vast industries, prompting workers to demand more protections.
Tensions between companies and employees are spilling over in more public ways, thanks in part to social media; workers are using platforms like X and TikTok to amplify their message or try to shame their employer, says Alison Taylor, clinical associate professor at NYU Stern School of Business and author of a new book, Higher Ground . One of the most interesting recent trends, she says, has been the rise of “strategic leaking, where young employees undercut sunny messaging from the top with their own lived experiences.” She cites the trend of sharing layoff experiences on TikTok as an example.
Battles are also brewing over DEI, including a political backlash by conservatives, complicating corporate efforts to meet their own DEI goals. Last year, a number of high-profile chief diversity officers exited their roles at some of the biggest U.S. companies, including Walt Disney and Netflix . This month, Zoom Video Communications fired a team focused on DEI initiatives as part of a round of layoffs.
The issue is also bubbling up in the presidential race. During a rally in Philadelphia last year, presidential hopeful Donald Trump promised to eliminate all diversity, equity, and inclusion programs “across the entire federal government.”
Many companies say they remain committed to DEI goals. According to a Conference Board survey late last year of chief human resource officers, none planned to scale back their diversity efforts, while 75% said improving the employee experience and organisational culture would be a top focus in 2024. Alphabet said in a statement that it is inaccurate to suggest it is “deprioritising our longstanding efforts for underrepresented communities.”
One company that scored well on labour and other sustainability factors was Walmart . The world’s largest retailer landed at 61 on the list. “Walmart stands out for its strong labour practices,” says Helen Mbugua-Kahuki, Calvert’s director of research. “We’ve seen Walmart do a really good job as it pertains to increasing wages for its workers.”
One of America’s largest employers, with 1.6 million U.S. workers, Walmart raised entry-level pay for store workers last year, taking its average hourly wage to $18, well above the federal minimum of $7.25. The company also increased wages for store managers to an average $128,000, plus better bonuses. A Walmart spokesperson said the retailer has been “investing in its front-line hourly associates for the past several years.”
Walmart’s other positives include education and training benefits, which the company says have saved workers nearly $500 million over the past five years. Calvert gives the company high marks for being more open to worker feedback through new digital forums . “It’s a form of open communication and provision for employees to freely express themselves,” Mbugua-Kahuki says.
Walmart still has its labour critics. The company has faced multiple lawsuits over gender discrimination. None of its roughly 4,700 U.S. stores have unionised, making it the largest U.S. employer without any unionised workers. In January, the National Labor Relations Board’s San Francisco office issued a complaint against a Walmart store in Eureka, Calif., alleging violations of labor rights. The NLRB said there are 21 other unfair labor practice cases open against Walmart.
Walmart has denied the NLRB’s allegations in a legal response . The company didn’t respond to a request for comment.
Other Faces of Sustainability
Calvert says Clorox, whose brands include its namesake bleach, Burt’s Bees cosmetics, and Glad trash bags, took top honours thanks to its strong governance structure and pay equity, among other factors. The firm’s board is diverse, with 50% women and 25% people of colour. In 2023, Clorox once again achieved pay equity, which means “no statistically significant differences” in pay by gender globally and race or ethnicity in the U.S., according to Clorox. “Pay equity is important because it creates a better culture,” says Madden.
Clorox’s shares underperformed the market in 2023, in part because of a cyberattack that caused wide-scale disruptions and hurt financial results. But its workers, at least, appear to be well treated, with perks including more flexible time for all. “We really intend for people to use this to refuel their tanks,” says Kirsten Marriner, chief people and corporate affairs officer.
About a fifth of this year’s list consists of newcomers. Game publisher Electronic Arts made the list for the first time, debuting at No. 32. Calvert says the company is making strides in DEI, including a push for better representation of women in its games. EA’s hugely popular Ultimate Team mode saw women football players introduced for the first time last year . Calvert also lauds the company for hiring “underrepresented talent” above the average rate in the industry for the fifth straight year and placing more minorities in executive roles. EA declined an interview but confirmed Calvert’s information.
Also making its debut this year is Trex, landing at No. 68. The company is a leading maker of “wood-alternative” home decking and railings made from a blend of recycled and reclaimed raw materials.
Some companies made a big leap up in this year’s ranking, among them Tetra Tech , which jumped from No. 56 to No. 8. Calvert singled out the consulting and engineering firm for its efforts to remediate toxic per- and polyfluoroalkyl substances, or PFAS, better known as “forever” chemicals. But it noted that Tetra Tech “could improve on human-capital management and offer more incentives for its employees.”
How We Ranked the Companies
To build our list of most sustainable companies, Barron’s worked with Calvert, a leader in ESG investing. Starting with the 1,000 largest publicly traded companies by market value—excluding real estate investment trusts—Calvert ranked each one by how it performed in five key constituency categories: shareholders, employees, customers, community, and the planet. Specifically, it looked at more than 230 ESG performance indicators from seven rating companies, including ISS, MSCI, and Sustainalytics, along with other data and Calvert’s internal research.
These data were organised into 28 topics that were then sorted into five categories. In the shareholder category, for example, topics included board structure, business ethics, and executive compensation. For employees, workplace diversity was a key topic. The planet category included greenhouse-gas, or GHG, emissions and related policies; biodiversity; and water stress. Calvert assigned a score of zero to 100 in each category, based on company performance. Then it created a weighted average of the categories for each company, based on how financially material the category was in its industry. To make Barron’s list, a company had to be rated above the bottom quarter in each material stakeholder category. If it performed poorly in any key category that was financially material, it was disqualified.
 Copyright 2020, Dow Jones & Company, Inc. All Rights Reserved Worldwide. LEARN MORE
This stylish family home combines a classic palette and finishes with a flexible floorplan
Just 55 minutes from Sydney, make this your creative getaway located in the majestic Hawkesbury region.
More than one fifth of Australians are cutting back on the number of people they socialise with
Australian social circles are shrinking as more people look for ways to keep a lid on spending, a new survey has found.
New research from Finder found more than one fifth of respondents had dropped a friend or reduced their social circle because they were unable to afford the same levels of social activity. The survey questioned 1,041 people about how increasing concerns about affordability were affecting their social lives. The results showed 6 percent had cut ties with a friend, 16 percent were going out with fewer people and 26 percent were going to fewer events.
Expensive events such as hens’ parties and weddings were among the activities people were looking to avoid, indicating younger people were those most feeling the brunt of cost of living pressures. According to Canstar, the average cost of a wedding in NSW was between $37,108 to $41,245 and marginally lower in Victoria at $36, 358 to $37,430.
But not all age groups are curbing their social circle. While the survey found that 10 percent of Gen Z respondents had cut off a friend, only 2 percent of Baby Boomers had done similar.
Money expert at Finder, Rebecca Pike, said many had no choice but to prioritise necessities like bills over discretionary activities.
“Unfortunately, for some, social activities have become a luxury they can no longer afford,” she said.
This stylish family home combines a classic palette and finishes with a flexible floorplan
Just 55 minutes from Sydney, make this your creative getaway located in the majestic Hawkesbury region.


