CBA First To Offer Crypto Services
The Commonwealth Bank announces strategic partnerships with global crypto leaders.
 2 min
2 min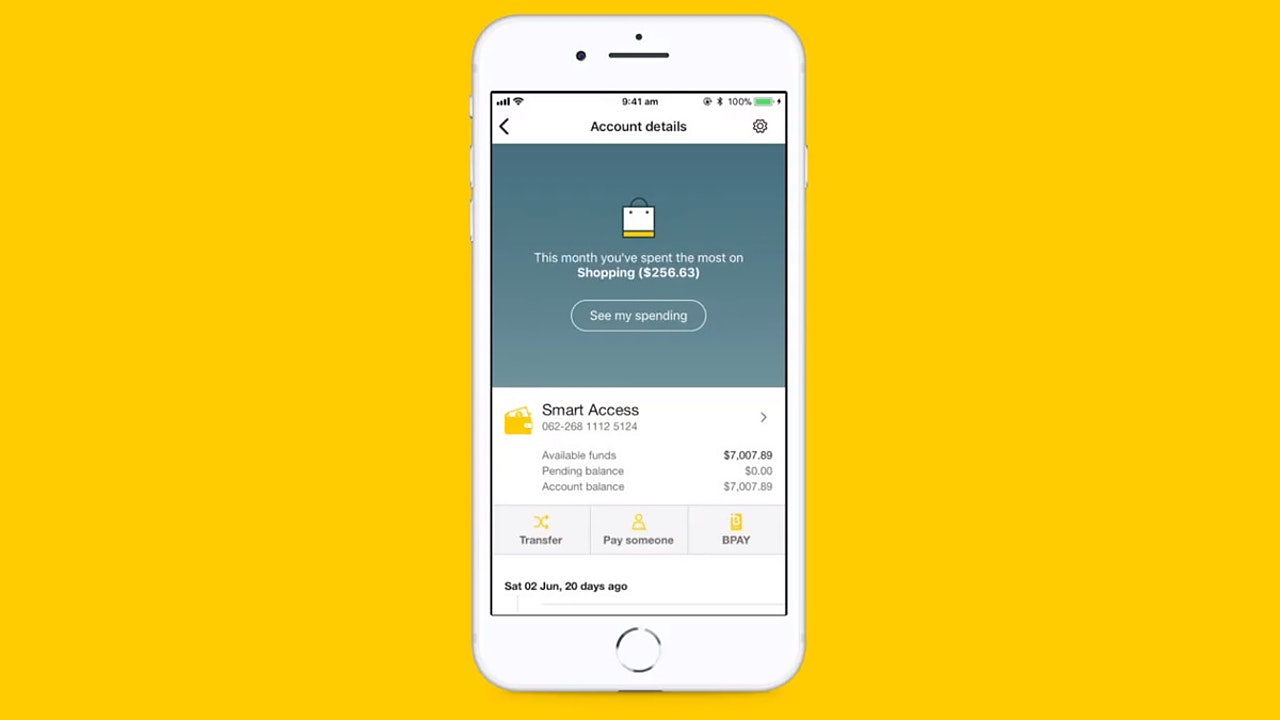
Commonwealth Bank has announced that it will become Australia’s first bank to offer customers the ability to buy, sell and hold crypto assets, directly through the Commbank app.
Partnering with one of the world’s largest regulated crypto exchanges, Gemini, and leading blockchain analysis firm, Chainalysis, the bank has been able to design a crypto exchange and custody service within its app.
The pilot will start in the coming weeks and CBA intends to progressively roll out more features to more customers in 2022. CBA will provide customers with access to up to ten selected crypto assets including Bitcoin, Ethereum, Bitcoin Cash and Litecoin.
According to CBA, research it has conducted has found a large number of its customers want access to crypto assets as an investment class.
CBA CEO Matt Comyn firmly believes in the future of crypto as an asset class and wants to cement the bank’s role as a facilitator of safe trading.
“We believe we can play an important role in crypto to address what’s clearly a growing customer need and provide capability, security and confidence in a crypto trading platform,” said Mr Comyn.
Dave Abner, Global Head of Business Development, Gemini, said: “We are proud to be providing exchange and custody services to CBA as they begin to unlock access to cryptocurrency investments for many Australians.
As part of its approach, CBA has also partnered with Chainalysis, a global leader in blockchain data and analytics to help compliance teams monitor and mitigate the threat of crime through crypto asset exchanges.
Michael Gronager, CEO and Co-Founder, Chainalysis, said: “Financial institutions like CBA play an integral role in growing cryptocurrency adoption safely. We are thrilled to be a part of this important alliance with CBA and our partner Gemini to play a pioneering role in building trust in cryptocurrencies in the Australian market.”

This stylish family home combines a classic palette and finishes with a flexible floorplan

Just 55 minutes from Sydney, make this your creative getaway located in the majestic Hawkesbury region.


Continued stagflation and cost of living pressures are causing couples to think twice about starting a family, new data has revealed, with long term impacts expected
2 min
Australia is in the midst of a ‘baby recession’ with preliminary estimates showing the number of births in 2023 fell by more than four percent to the lowest level since 2006, according to KPMG. The consultancy firm says this reflects the impact of cost-of-living pressures on the feasibility of younger Australians starting a family.
KPMG estimates that 289,100 babies were born in 2023. This compares to 300,684 babies in 2022 and 309,996 in 2021, according to the Australian Bureau of Statistics (ABS). KPMG urban economist Terry Rawnsley said weak economic growth often leads to a reduced number of births. In 2023, ABS data shows gross domestic product (GDP) fell to 1.5 percent. Despite the population growing by 2.5 percent in 2023, GDP on a per capita basis went into negative territory, down one percent over the 12 months.
“Birth rates provide insight into long-term population growth as well as the current confidence of Australian families,” said Mr Rawnsley. “We haven’t seen such a sharp drop in births in Australia since the period of economic stagflation in the 1970s, which coincided with the initial widespread adoption of the contraceptive pill.”
Mr Rawnsley said many Australian couples delayed starting a family while the pandemic played out in 2020. The number of births fell from 305,832 in 2019 to 294,369 in 2020. Then in 2021, strong employment and vast amounts of stimulus money, along with high household savings due to lockdowns, gave couples better financial means to have a baby. This led to a rebound in births.
However, the re-opening of the global economy in 2022 led to soaring inflation. By the start of 2023, the Australian consumer price index (CPI) had risen to its highest level since 1990 at 7.8 percent per annum. By that stage, the Reserve Bank had already commenced an aggressive rate-hiking strategy to fight inflation and had raised the cash rate every month between May and December 2022.
Five more rate hikes during 2023 put further pressure on couples with mortgages and put the brakes on family formation. “This combination of the pandemic and rapid economic changes explains the spike and subsequent sharp decline in birth rates we have observed over the past four years,” Mr Rawnsley said.
The impact of high costs of living on couples’ decision to have a baby is highlighted in births data for the capital cities. KPMG estimates there were 60,860 births in Sydney in 2023, down 8.6 percent from 2019. There were 56,270 births in Melbourne, down 7.3 percent. In Perth, there were 25,020 births, down 6 percent, while in Brisbane there were 30,250 births, down 4.3 percent. Canberra was the only capital city where there was no fall in the number of births in 2023 compared to 2019.
“CPI growth in Canberra has been slightly subdued compared to that in other major cities, and the economic outlook has remained strong,” Mr Rawnsley said. “This means families have not been hurting as much as those in other capital cities, and in turn, we’ve seen a stabilisation of births in the ACT.”
This stylish family home combines a classic palette and finishes with a flexible floorplan
Just 55 minutes from Sydney, make this your creative getaway located in the majestic Hawkesbury region.