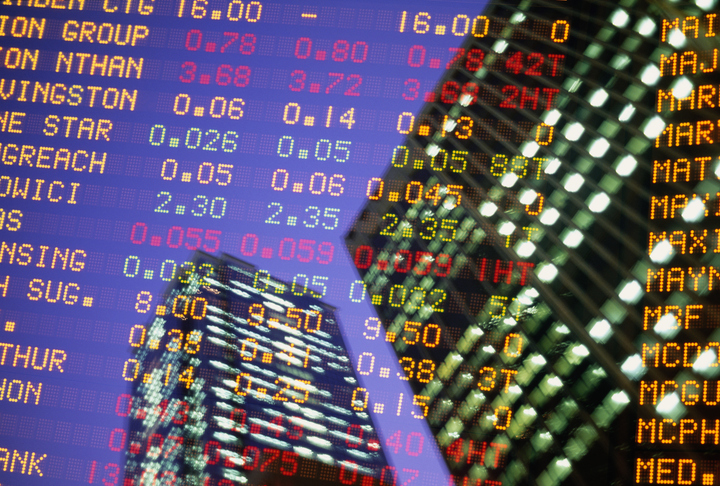
Diversifying With Collectibles
Sales of global collectibles are expected to grow to US$692 billion over the next 10 years.

 3 min
3 min
The collectibles market is booming. During the pandemic, folks with old collections dug them out, new collectors came to market, and trading activity and prices across categories from sports memorabilia to fine wines soared.
“I can’t even count the number of people who contacted us during the pandemic who hadn’t touched their collections in more than 10 years,” says Scott English, executive director of the American Philatelic Society in Bellefonte, Pa., who welcomed attention on stamps when four 1918 Inverted Jenny stamps—so-called because they were printed with an upside down airplane—fetched a record US$4.9 million at Sotheby’s last year.
Sales of global collectibles are expected to grow to US$692 billion from $412 billion over the next 10 years, according to Market Decipher, a Canadian market research firm.
For investors, a long view is advisable, says David Savir, CEO of Element Pointe Advisors, a wealth management firm in Miami. “Many collectibles are at values that may not be sustainable for the next two to three years,” he says. “Anyone buying should be holding them for over a decade and not expect to profit in the short term.”
The highest level of trading activity is in sports collectibles, boosted by the entry of sports-related nonfungible tokens, or NFTs, which exploded to $1 billion in sales last year—bigger than the entire 2020 NFT market—and are expected to reach $2 billion this year, according to the London-based consultancy Deloitte.
The overall NFT market surged to $24.9 billion last year, including digital creations from high-end fine art to collectibles. Sales of popular collectible series haven’t waned: In March, sales of Bored Ape Yacht Club and CryptoPunks hit $257 million and $81 million, respectively, according to CryptoSlam, an aggregator of NFT data.
Tangible sports memorabilia aren’t taking a back seat to NFTs: Sales in the traditional $4 billion arena have been breaking records. Last year, a Dallas Mavericks star Luka Doncic rookie NBA trading card sold for $4.6 million—the most fetched for a basketball card—and a 1952 Mickey Mantle card hit a record for baseball cards, at $5.2 million.
For classic cars, the first quarter of each year is when three of the biggest car auctions take place, says Juan Calle, co-founder and CEO of Classic.com, a site that tracks car market data. This year’s quarter closed with a total sales volume of $1.3 billion, double the same period last year, Calle says.
While other categories have less practical value, they can be attractive diversifiers for investment portfolios.
Consider fine wine’s low correlation to the S&P 500: just 0.3, which is lower than gold, real estate, or any traditional portfolio-balancing asset class, says Anthony Zhang, co-founder and CEO of Vinovest, which runs a portfolio of 500,000 collectible wine bottles stored in custom-built warehouses around the world. “We’ve seen a big uptick in interest from people who you wouldn’t traditionally think of as wine enthusiasts,” he says.
The wine market tends to shrug off factors that send stocks reeling, but has other sensitivities, such as tariffs and even gift-giving policies in authoritarian nations. When China banned gifts to government employees in 2011, popular Bordeaux wine values plummeted, says Robbie Stevens, Americas Territory Manager for London-based Liv-ex, a global marketplace for fine wine.
The broad Liv-ex 1000 index was up 19% in 2021, driven primarily by the popularity of Champagne and Burgundy. In the 12 months through March, Liv-ex’s index for Champagne was up 47.8%, and for Burgundy, 36.8%.
But no category is immune to broad economic trends, says financial advisor Savir. “Collectibles are more vulnerable to price declines in a recession than other assets, given the nonessential nature of many of them.”
This article appeared in the June 2022 issue of Penta magazine.
 Copyright 2020, Dow Jones & Company, Inc. All Rights Reserved Worldwide. LEARN MORE


This stylish family home combines a classic palette and finishes with a flexible floorplan

Just 55 minutes from Sydney, make this your creative getaway located in the majestic Hawkesbury region.


Continued stagflation and cost of living pressures are causing couples to think twice about starting a family, new data has revealed, with long term impacts expected
2 min
Australia is in the midst of a ‘baby recession’ with preliminary estimates showing the number of births in 2023 fell by more than four percent to the lowest level since 2006, according to KPMG. The consultancy firm says this reflects the impact of cost-of-living pressures on the feasibility of younger Australians starting a family.
KPMG estimates that 289,100 babies were born in 2023. This compares to 300,684 babies in 2022 and 309,996 in 2021, according to the Australian Bureau of Statistics (ABS). KPMG urban economist Terry Rawnsley said weak economic growth often leads to a reduced number of births. In 2023, ABS data shows gross domestic product (GDP) fell to 1.5 percent. Despite the population growing by 2.5 percent in 2023, GDP on a per capita basis went into negative territory, down one percent over the 12 months.
“Birth rates provide insight into long-term population growth as well as the current confidence of Australian families,” said Mr Rawnsley. “We haven’t seen such a sharp drop in births in Australia since the period of economic stagflation in the 1970s, which coincided with the initial widespread adoption of the contraceptive pill.”
Mr Rawnsley said many Australian couples delayed starting a family while the pandemic played out in 2020. The number of births fell from 305,832 in 2019 to 294,369 in 2020. Then in 2021, strong employment and vast amounts of stimulus money, along with high household savings due to lockdowns, gave couples better financial means to have a baby. This led to a rebound in births.
However, the re-opening of the global economy in 2022 led to soaring inflation. By the start of 2023, the Australian consumer price index (CPI) had risen to its highest level since 1990 at 7.8 percent per annum. By that stage, the Reserve Bank had already commenced an aggressive rate-hiking strategy to fight inflation and had raised the cash rate every month between May and December 2022.
Five more rate hikes during 2023 put further pressure on couples with mortgages and put the brakes on family formation. “This combination of the pandemic and rapid economic changes explains the spike and subsequent sharp decline in birth rates we have observed over the past four years,” Mr Rawnsley said.
The impact of high costs of living on couples’ decision to have a baby is highlighted in births data for the capital cities. KPMG estimates there were 60,860 births in Sydney in 2023, down 8.6 percent from 2019. There were 56,270 births in Melbourne, down 7.3 percent. In Perth, there were 25,020 births, down 6 percent, while in Brisbane there were 30,250 births, down 4.3 percent. Canberra was the only capital city where there was no fall in the number of births in 2023 compared to 2019.
“CPI growth in Canberra has been slightly subdued compared to that in other major cities, and the economic outlook has remained strong,” Mr Rawnsley said. “This means families have not been hurting as much as those in other capital cities, and in turn, we’ve seen a stabilisation of births in the ACT.”
This stylish family home combines a classic palette and finishes with a flexible floorplan
Just 55 minutes from Sydney, make this your creative getaway located in the majestic Hawkesbury region.