For Apple, India Is the Next China
Apple’s move to open its famed retail store in India signals the market is a high priority

 3 min
3 min in Mumbai. The store's design is inspired by the kaali-peeli (black & yellow) taxi art which is unique to Mumbai. Tim Cook, Chief Executive Officer (CEO) is likely to visit for the company's first exclusive store launch in the month of April. Thus far, Apple has only sold its goods and offers services in India through third-party retailers or through online. (Photo by Ashish Vaishnav/SOPA Images/LightRocket via Getty Images)")
Apple’s playbook in India is evolving, from testing the country as a counterweight to China’s supply-chain dominance to viewing it as an emerging growth hub for demand.
Both of these strategies are working off each other.
Last week, Apple unveiled the look of its first retail store in India that is set to open this month, signalling India’s growing importance for the Cupertino, Calif.-based company. Until now Apple has sold iPhones and other products in the country mostly through resellers, e-commerce websites and large format retail chains. With the opening of its own famed brick-and-mortar store, it is adding another critical layer to this wide distribution.
The move isn’t surprising given Chief Executive Tim Cook in February called India a major focus for Apple, adding that the company is putting a lot of emphasis on the market. On the call, Apple said it posted record iPhone revenue in India in the December quarter, though they didn’t give a specific figure, even as overall revenue declined.
It is no secret that Apple has been growing its manufacturing base in India as it works on a China + 1 strategy. But this narrative has overshadowed India’s steady climb up the luxury ladder over the past few years, and the opportunity it presents for Apple to find the next lucrative market similar to China.
Making iPhones and then selling them in India ensures a smooth supply chain—a page directly out of Apple’s massive success in China over the past decade. Daniel Ives, an analyst with Wedbush Securities, believes that now the company will have “skin in the game” building out production in India with retail success along the way.
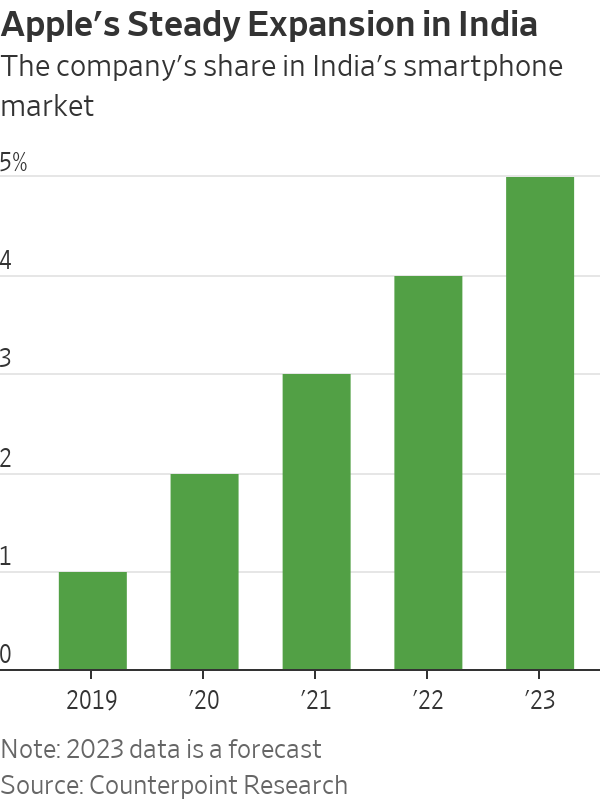
For several years, Apple struggled to make a dent in the Indian market and compete against more affordable Chinese models. Only now is it gaining traction. Apple had a mere 1% market share in 2019 and may cross a 5% share this year in the country’s overall smartphone market, according to Counterpoint Research. To be sure, that contrasts with Apple’s market share in China of 22% in the last quarter of 2022.
Still the market has potential, even if prices of iPhones may have to come down further. According to another research firm, Canalys, India’s premium smartphone segment, defined by sale prices above $500, has doubled to 6% of overall market share last year from 3.1% in 2019, and Apple’s share of this segment was at 60.13% last year.
Harsh Kumar, an analyst at Piper Sandler, argues that India and China are quite similar in their demographics and even in their potential buying power, at least in large cities—and that India can show large numbers for Apple with some effort.
India is the second-largest smartphone market globally, both in terms of annual shipments and sales, accounting for almost 12% of the global market, according to market intelligence firm IDC. Despite this, smartphone penetration is still less than 50%—providing an unmatched potential for growth for Apple.
Navkendar Singh, an analyst at tech researcher IDC, believes that Apple’s work on channel expansion, focus on affordability through attractive trade-in programs, discounts, cash-back offers and better pricing on prior-generation models are finally bearing fruit. But the gap between Apple and other models is still quite wide—the average selling price of a smartphone in India was $206 last year, excluding taxes, vs. $898 for an iPhone, according to Canalys.
But the price of Apple’s cheapest model can go below $500 with discounts. A larger manufacturing base with a thriving component ecosystem in India could bring prices down a bit further.
India is at the forefront of Apple’s efforts to decouple from China’s factory floor but may even prove itself as a growth market—with some conditions applied, of course.
 Copyright 2020, Dow Jones & Company, Inc. All Rights Reserved Worldwide. LEARN MORE


Automobili Lamborghini and Babolat have expanded their collaboration with five new colourways for the ultra-exclusive BL.001 racket, limited to just 50 pieces worldwide.

As housing drives wealth and policy debate, the real risk is an economy hooked on growth without productivity to sustain it.


As housing drives wealth and policy debate, the real risk is an economy hooked on growth without productivity to sustain it.
3 minFor decades, Australia has leaned into its reputation as the lucky country. But luck, as it turns out, is not an economic strategy.
What once looked like resilience now appears increasingly fragile. Beneath the surface of rising property values and steady headline growth, the Australian economy is showing signs of strain that can no longer be ignored.
Recent data paints a sobering picture. Australia has recorded one of the largest declines in real household disposable income per capita among advanced economies.
Wages have failed to keep pace with inflation, meaning many Australians are working harder for less. On a per capita basis, income growth has stalled and, at times, reversed.
And yet, on paper, things still look relatively solid. GDP is growing. Unemployment remains low. But that growth is increasingly being driven by population expansion rather than productivity.
More people are contributing to output, but not necessarily improving living standards.
That distinction matters.
For years, Australia’s economic success rested on a powerful combination: a once-in-a-generation mining boom, a credit-fuelled housing market, strong migration and a property sector that rarely faltered. Between 1991 and 2020, the country avoided recession entirely, building enormous wealth in the process.
But much of that wealth is tied to property. Around two-thirds of household wealth sits in real estate, inflated by leverage and sustained by demand. It has worked, until now.
The problem is the supply side of the economy has not kept up.
Housing supply is falling behind population growth. Rental vacancies are near record lows.
Construction firms are collapsing at an elevated rate. At the same time, massive infrastructure pipelines are competing with residential projects for labour and materials, pushing costs higher and delaying delivery.
The result is a system under pressure from all angles.
Despite near full employment, productivity growth has stagnated for years. In simple terms, Australians are putting in more hours without generating more output per hour. The economy is running faster, butgoing nowhere.
Meanwhile, government spending continues to expand. Public debt is approaching $1 trillion, with spending now accounting for a record share of GDP.
The gap between spending and revenue has been filled by borrowing for decades, adding further pressure to an already stretched system.
This is where the uncomfortable question emerges.
Has Australia become too reliant on a model driven by rising property values, expanding credit and population growth?
As asset prices rise, households feel wealthier and borrow more. Banks lend more. Governments collect more revenue. Migration fuels demand. The cycle reinforces itself.
But when productivity stalls and debt outpaces real income, the system begins to depend on constant expansion just to stay stable.
It is not a collapse scenario. But it is not particularly stable either.
Nowhere is this more evident than in housing.
The National Housing Accord targets 1.2 million new homes over five years, yet current completion rates are well below that pace. With approvals falling and construction costs rising, the gap between supply and demand is widening, not narrowing.
Housing is also one of the largest contributors to inflation, with costs rising sharply across rents, construction and utilities. Yet the private sector, from small investors to major developers, is struggling to make projects stack up in the current environment.
This brings the policy debate into sharper focus.
Tax settings such as negative gearing and capital gains concessions have undoubtedly boosted demand over the past two decades. But they have also supported supply. Removing them may ease prices briefly, but risks deepening the supply shortage over time.
That is the paradox.
Policies designed to make housing more affordable can, in practice, make the shortage worse if they discourage development. The optics may appeal, but the economics are far less forgiving.
It is also worth remembering that most property investors are not institutional players. The majority own just one investment property. They are, in many cases, ordinary Australians using real estate as their primary wealth-building tool.
Undermining that system without replacing it with a viable alternative risks unintended consequences, from reduced supply to higher rents and increased inflation.
So where does that leave Australia?
At a crossroads.
The country can continue to rely on population growth and rising asset prices to drive economic activity. Or it can shift towards a model built on productivity, innovation and sustainable growth.
The latter is harder. It requires structural reform, long-term thinking and political discipline.
But it is also the only path that leads to genuine, lasting prosperity.
The question is no longer whether Australia has been lucky.
It is whether it can evolve before that luck runs out.
Paul Miron is the Co-Founder & Fund Manager of Msquared Capital.

Hand-built in Melbourne and limited to just 10 cars a year, the Zeigler/Bailey Z/B 4.4 is reshaping what a modern collector car can be.

Powerhouse real estate couple Avi Khan and Kaylea Sayer welcome their daughter while balancing record-breaking careers, proving success and family can grow side by side.