Get Ready for the Full-Employment Recession
Job growth is soaring yet output is falling, by one measure. Blame a historic slump in productivity.
You would think from May’s blowout jobs report the economy was booming.
Here’s the puzzle: Other recent data suggest it is in recession.
The dichotomy emerges from the divergent behaviour of employment and output, two key indicators of economic activity.
In May, employers added 339,000 jobs, bringing the total number of jobs added this year to nearly 1.6 million, a gain of 2.5% annualised.
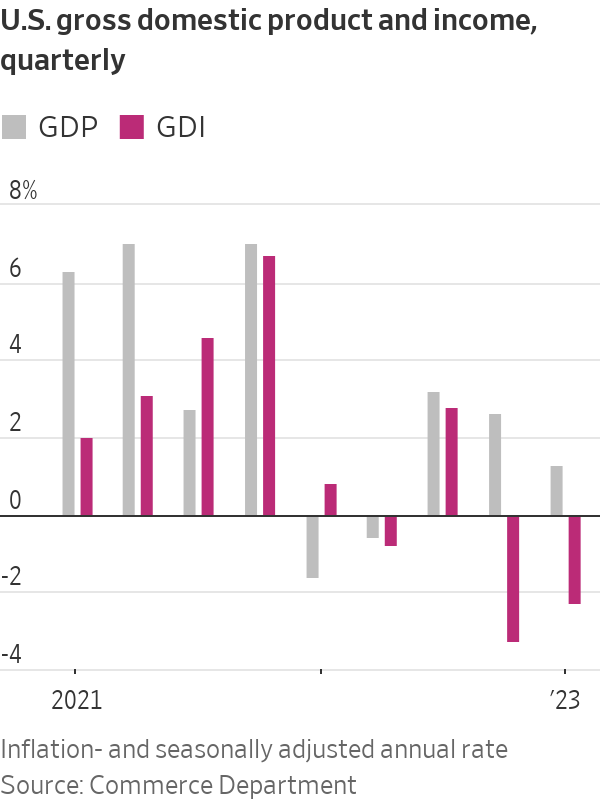
But real gross domestic income, a measure of total economic activity, shrank in both the fourth quarter and the first quarter. Two negative quarters of output growth are one indicator of a recession.
The economy has gone through periods where output has expanded faster than employment, but seldom the other way around, said Ryan Sweet, chief U.S. economist at Oxford Economics.
What explains these dissonant signals is productivity, or output per hour worked: It is cratering. That raises questions about whether the much-hyped technology adoption during the pandemic and, more recently, artificial intelligence are making a difference. It also raises the risk that the Federal Reserve will have to raise interest rates more to tame inflation.
Labor productivity fell 2.1% in the first quarter from the fourth at an annual rate, and was down 0.8% in the first quarter from a year earlier, the Labor Department said Thursday. That is the fifth-straight quarter of negative year-over-year productivity growth—the longest such run since records began in 1948.
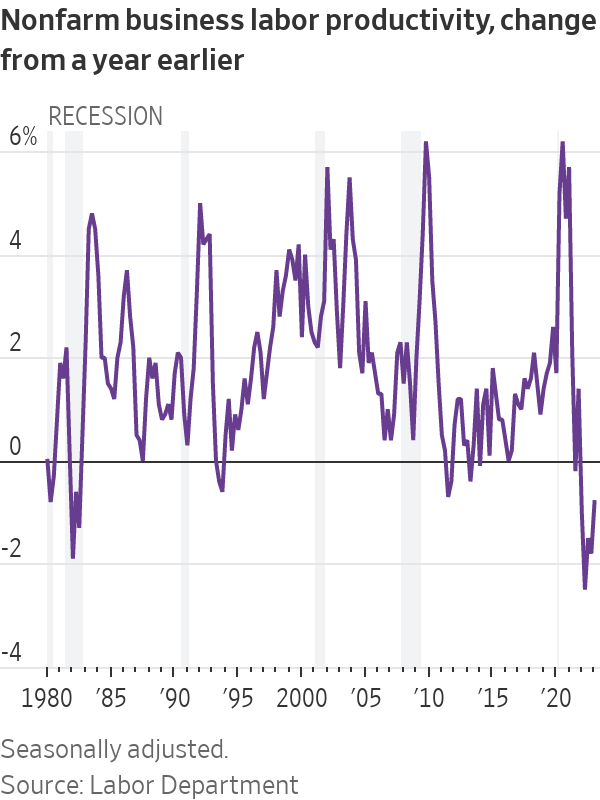
Those calculations are derived from gross domestic product, which shows output rising at a 1.3% annualised rate in the first quarter. But another key measure—gross domestic income—declined, implying an even bigger productivity collapse.
GDI is the yin to GDP’s yang, measuring incomes earned in wages and profits, while GDP tallies up purchases of goods and services produced. In theory, the two should be equal, since someone’s spending is another’s income.
They never exactly match because of statistical challenges. Lately, though, the divergence is dramatic. “Over the past two quarters, real GDP shows the economy expanding by 1.0%, not far off potential growth, whereas GDI shows it contracting by 1.4%, which amounts to a decent-sized recession,” said Paul Ashworth, chief U.S. economist at Capital Economics. The divergence is ominous: GDI previously undershot GDP dramatically during the 2007-09 financial crisis and in the early 1990s recession, Ashworth said.
The second quarter is also shaping up to be weak. S&P Global Market Intelligence sees second-quarter real GDP expanding at a 0.8% annual rate; Morgan Stanley projects 0.3%. The Atlanta Fed’s GDPNow model estimates 2%. Most economists don’t forecast GDI.
Usually, employment plummets during recessions because as factories, offices and restaurants produce less, they need fewer workers. That clearly isn’t happening. “If you look at the early 2000s, that was what was called a ‘jobless recovery,’ because employment took a long time to come back even though the economy was growing,” said Sweet. “This time around it could be the opposite—the economy could be contracting, but you’re not seeing job losses.”
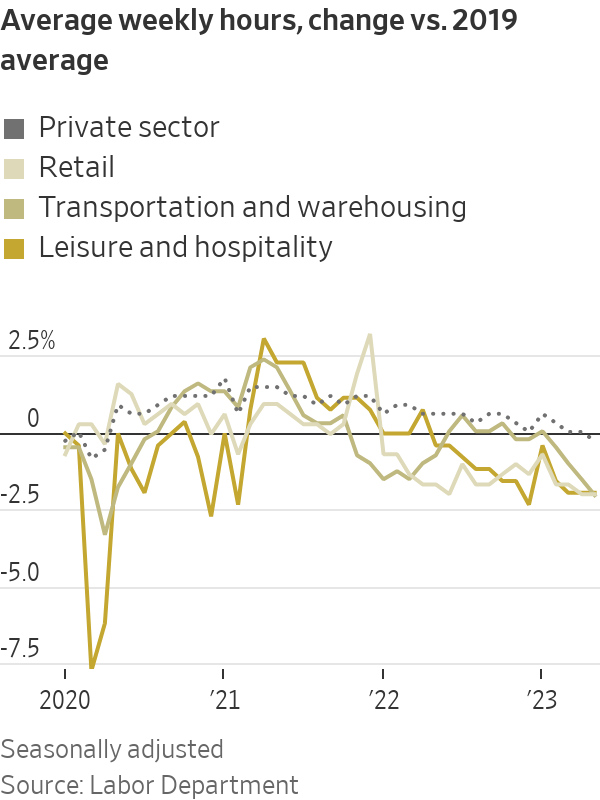
One reason could be labor hoarding. After struggling to hire and train workers during the pandemic-induced labor crunch, employers are now balking at letting them go, even as sales slip, given the labor market’s unusual tightness. There were 10.1 million vacant jobs in April, well above the 5.7 million people looking for work that month. Some firms—particularly services such as restaurants and travel-related businesses—ran short-staffed for the past couple of years and are still catching up.
A possible sign of this is hours worked per week, which in May fell slightly below the 2019 average, after having surged during the pandemic. This drop has been particularly sharp in retail and leisure-and-hospitality—industries that have been especially strapped for workers. The unemployment rate also rose in May, one sign of a potential cooling in the labour market.
It’s “not that technology got worse in the last year, but that businesses were selling less stuff and they’re nervous about their ability to attract employees, so they’re holding on to their employees,” said Jason Furman, an economist at Harvard University who served in the Obama administration. It is also plausible, he said, that the shift to working from home generated a hit to productivity, whose impact grows with the cumulative loss of creative exchange and mentoring.
Productivity growth is important in the long run because it is one of two engines of economic growth, the other being an expanding workforce. Sweet, the Oxford Economics economist, notes businesses have been spending on equipment, software and intellectual property, investments that should eventually raise productivity. Though it may take many years, so should recent advances in artificial intelligence.
A more imminent concern is that when workers produce more, companies can raise wages without increasing prices. When productivity falls, it is harder to keep inflation in check.
This could make things even more challenging for the Fed. “Companies probably have the ability to pass on higher prices to consumers if they want to,” said Neil Dutta, head of economic research at Renaissance Macro Research. “That would be problematic for the Fed.”
Moreover, if GDI is a better indicator of output than GDP, “it would mean that the economy has slowed more than we had thought, without bringing down inflation that much,” Furman said. That might mean it will ultimately take an even bigger economic pullback “to bring inflation down.”
 Copyright 2020, Dow Jones & Company, Inc. All Rights Reserved Worldwide. LEARN MORE
This stylish family home combines a classic palette and finishes with a flexible floorplan
Just 55 minutes from Sydney, make this your creative getaway located in the majestic Hawkesbury region.
Continued stagflation and cost of living pressures are causing couples to think twice about starting a family, new data has revealed, with long term impacts expected
Australia is in the midst of a ‘baby recession’ with preliminary estimates showing the number of births in 2023 fell by more than four percent to the lowest level since 2006, according to KPMG. The consultancy firm says this reflects the impact of cost-of-living pressures on the feasibility of younger Australians starting a family.
KPMG estimates that 289,100 babies were born in 2023. This compares to 300,684 babies in 2022 and 309,996 in 2021, according to the Australian Bureau of Statistics (ABS). KPMG urban economist Terry Rawnsley said weak economic growth often leads to a reduced number of births. In 2023, ABS data shows gross domestic product (GDP) fell to 1.5 percent. Despite the population growing by 2.5 percent in 2023, GDP on a per capita basis went into negative territory, down one percent over the 12 months.
“Birth rates provide insight into long-term population growth as well as the current confidence of Australian families,” said Mr Rawnsley. “We haven’t seen such a sharp drop in births in Australia since the period of economic stagflation in the 1970s, which coincided with the initial widespread adoption of the contraceptive pill.”
Mr Rawnsley said many Australian couples delayed starting a family while the pandemic played out in 2020. The number of births fell from 305,832 in 2019 to 294,369 in 2020. Then in 2021, strong employment and vast amounts of stimulus money, along with high household savings due to lockdowns, gave couples better financial means to have a baby. This led to a rebound in births.
However, the re-opening of the global economy in 2022 led to soaring inflation. By the start of 2023, the Australian consumer price index (CPI) had risen to its highest level since 1990 at 7.8 percent per annum. By that stage, the Reserve Bank had already commenced an aggressive rate-hiking strategy to fight inflation and had raised the cash rate every month between May and December 2022.
Five more rate hikes during 2023 put further pressure on couples with mortgages and put the brakes on family formation. “This combination of the pandemic and rapid economic changes explains the spike and subsequent sharp decline in birth rates we have observed over the past four years,” Mr Rawnsley said.
The impact of high costs of living on couples’ decision to have a baby is highlighted in births data for the capital cities. KPMG estimates there were 60,860 births in Sydney in 2023, down 8.6 percent from 2019. There were 56,270 births in Melbourne, down 7.3 percent. In Perth, there were 25,020 births, down 6 percent, while in Brisbane there were 30,250 births, down 4.3 percent. Canberra was the only capital city where there was no fall in the number of births in 2023 compared to 2019.
“CPI growth in Canberra has been slightly subdued compared to that in other major cities, and the economic outlook has remained strong,” Mr Rawnsley said. “This means families have not been hurting as much as those in other capital cities, and in turn, we’ve seen a stabilisation of births in the ACT.”
This stylish family home combines a classic palette and finishes with a flexible floorplan
Just 55 minutes from Sydney, make this your creative getaway located in the majestic Hawkesbury region.


