Green Investors Were Crushed. Now It’s Time to Make Money.
The lessons have been hard, and are a reminder of the basic facts of investing

 4 min
4 min
Invest according to your political views, and you’re unlikely to make money. Companies that appeal to left-wingers or to right-wingers might be good or bad investments, but the fact of being, on current politics, clean and union-friendly for the left or oily and gun-friendly for the right is neither here nor there. What matters is their ability to make money and how highly they are valued.
This has been rammed home for environmentally-minded investors in the past year, as a coordinated selloff in anything with green credentials crushed the idea of making money while doing good.
It turns out that the real world is tougher than advocates of ESG—environmental, social and governance—investing claimed. The lessons have been hard, but should remind investors in the sector of some of the basic facts of investing. The fall in prices has improved the outlook for the stocks.
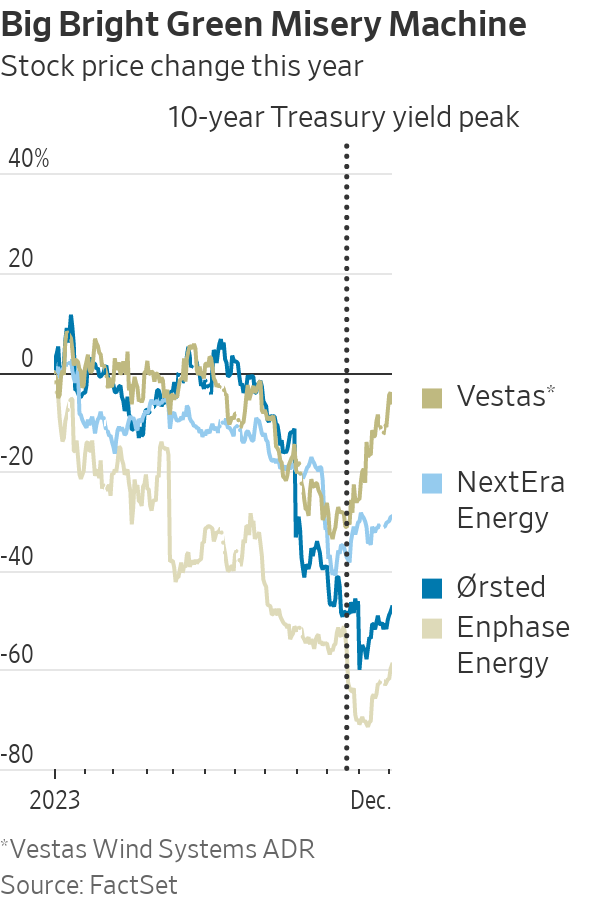
This year has been almost universally bad for clean investments. The two worst performers still in the S&P 500 are solar companies Enphase Energy and SolarEdge Technologies, down 60% and 70%, respectively. Hydrogen stocks have fallen sharply, led by Plug Power, which warned it might not survive. Wind-farm developers have been doing so badly they have pulled out of some contracts, with Denmark’s Ørsted off 48% in dollar terms and Florida-based NextEra Energy off 29%.
Electric cars have disappointed too, hitting startups and suppliers and pushing the price of lithium ores, used to produce the battery metal, down by three-quarters or more, although market-leader Tesla’s stock has been an exception.
Just as there was a coordinated green selloff, there has been a coordinated partial rebound in the past month or so.
This provides the first lesson: debt. The clean-energy sector is dependent on vast amounts of borrowing, so high interest rates really hurt. Roman Boner, who runs a clean-energy fund at Dutch fund manager Robeco, points out that major projects are typically financed with 80% debt, so rises in financing costs have a big impact on competitiveness.
Investors who bought into green stocks probably didn’t think they were making a leveraged bet on Treasurys, but that is what they ended up with. It isn’t only about corporate financing costs, either. High borrowing costs hit consumer demand for rooftop solar and for electric cars, both of which are often leased, since leasing costs depend on the cost of debt.
At a very high level, this is about long-term thinking. Low rates encourage investors to think long term, because they make future profits almost as valuable as current profits, and encourage borrowing to try to secure those future profits.
High rates encourage short-term thinking, by making profits today far more valuable than future profits—why bet on the future when you can earn 5% from Treasury bills? Short-term we get fossil-fuel profits, while long-term we get either clean energy or global warming; recently investors have been encouraged by rising rates to think short term.
The second lesson: government. Ronald Reagan overstated it when he said: “The nine most terrifying words in the English language are: ‘I’m from the government, and I’m here to help.’” But investors who rely on state subsidies to ensure profits leave themselves at the mercy of both fickle politicians and the bureaucrats Reagan was concerned about. This year’s selloff has been worsened by the bureaucrats and their failure to provide the details of many of the subsidies promised in last year’s badly named Inflation Reduction Act.
“We’re still hoping to get them by year end,” says Ed Lees, co-head of the environmental strategies group at BNP Paribas Asset Management. The next problem might be the politicians, at least if Donald Trump wins the presidency and torches the IRA. Lees thinks this will be hard, because so many IRA-subsidised projects are heading for Republican states. But Trump certainly has no sympathy for environmental causes.
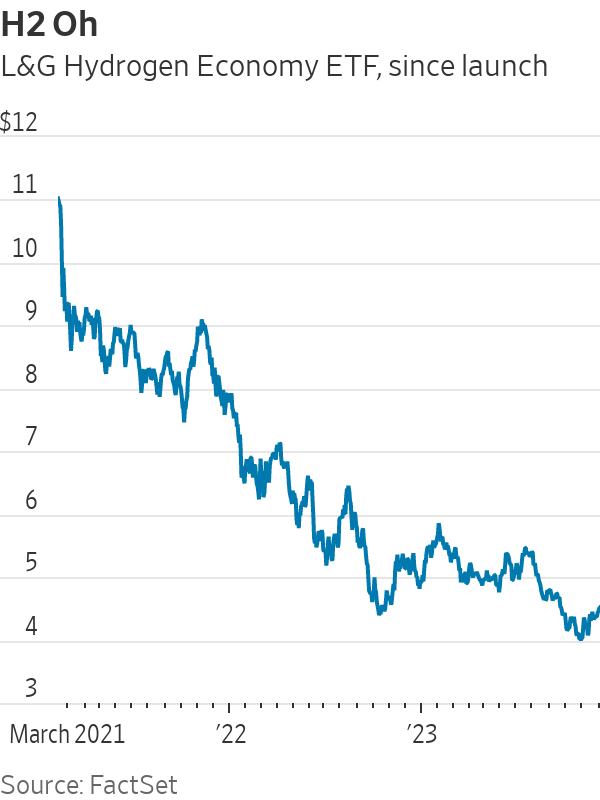
The third lesson is the one most relevant to buying today: valuation. Buying stocks when they are trendy and wildly overpriced is a recipe for disaster. Perhaps the most extreme example of late is the L&G Hydrogen Economy ETF, launched in London at the height of clean-energy excitement in February 2021. It plummeted from day one, never regained its launch price, and is down 55% since then.
“We’ve seen a very harsh reality check,” said Sonja Laud, chief investment officer of L&G Investment Management.
The question is whether the hype has left. Laud worries that one year of high rates won’t have crushed all the excesses built up in 12 years of near-zero rates. But clearly valuations are much lower than they were, and she is hopeful there are opportunities to be found now.
“The huge green premium you had previously is no longer there,” says Velislava Dimitrova, who runs sustainable funds at Fidelity International. Clean-energy stocks are “much more interesting than they used to be—I don’t believe that renewables are dead.”
In the bond market, investors are no longer paying much if any “greenium,” or extra price for green bonds. In stocks, it is harder to judge: The S&P Global Clean Energy index trades at a discount to the global market on some measures, but not others, making it difficult to conclude that the sector as a whole is a wonderful bargain.
Still, it is good news for buyers that the hype has evaporated. Investors who care about profits more than purpose can finally consider clean-energy stocks again.
 Copyright 2020, Dow Jones & Company, Inc. All Rights Reserved Worldwide. LEARN MORE


A record-breaking $11 million sale at The Centennial Collection has set a new benchmark for luxury apartment living in Bondi Junction.

As interest rates, inflation and market sentiment fluctuate, investors are being urged to focus on data, not panic.


The Federal Budget may have softened some of its proposed tax reforms, but it has exposed a bigger issue: too many families are relying on wealth structures that no longer reflect the realities of modern life.
3 min
For many Australians, the 2026 Federal Budget initially felt like a direct challenge to the way wealth is created, held and transferred between generations.
The headlines were immediate: changes to capital gains tax, reforms to discretionary trusts, restrictions on negative gearing and increased scrutiny of investment structures. Unsurprisingly, affluent families, business owners and investors began asking the same question:
Is the way we hold our wealth still fit for purpose?
In recent days, the government has announced several significant amendments following industry consultation and public feedback, including exempting testamentary trusts from the proposed 30 per cent minimum tax and expanding capital gains tax concessions for small businesses.
The backdown is welcome. But it also highlights something much bigger.
This Budget has accelerated a conversation that many Australian families have been postponing for years.
The conversation is not really about tax. It is about wealth stewardship.
For decades, Australians have built wealth through businesses, property, investments and careful long-term planning. Yet many families have not revisited the legal structures surrounding those assets in years, sometimes decades.
We often see clients who have spent years building significant wealth, only to discover their legal arrangements no longer reflect their current circumstances.
Their children are now adults. They may own multiple properties.
They may have sold a business, entered a second marriage, become grandparents or accumulated digital assets that did not exist when their original estate plans were prepared.
The trust that distributes income may need to be reconsidered. The bucket company may no longer be so attractive.
The Budget has simply exposed a reality that already existed: wealth structures cannot remain static while life continues to evolve.
Importantly, trusts themselves are not the issue.
Trusts are legitimate planning tools that provide flexibility, protection and continuity. When used appropriately, they allow families to adapt to changing circumstances over time.
And neither is tax the issue, really. Getting the fundamentals right is more important for long-term, sustainable wealth than a few favourable tax treatments around the edges.

The real issue is complacency.
Too often, families create structures and assume the job is done. It isn’t.
Estate planning is no longer a document you sign once and file away in a drawer. It is an ongoing process that should evolve alongside your life.
We are also seeing a broader shift in how Australians define wealth itself. It is no longer just the family home and an investment portfolio.
Modern wealth includes businesses, digital assets, cryptocurrency, intellectual property, frequent flyer points and increasingly complex family arrangements.
At the same time, Australians are living longer than ever before, meaning wealth may need to support multiple generations simultaneously. This creates new responsibilities and new risks.
How do you help your children enter the property market without exposing family wealth to relationship breakdowns?
How do you structure wealth so that it remains a source of opportunity rather than future conflict?
These are the questions families should be asking now.
The recent debate surrounding testamentary trusts also serves as an important reminder that policy decisions can have unintended consequences for vulnerable Australians. It is encouraging that the government has listened to feedback and clarified its position.
But the lesson remains: the wealth landscape is changing.
Increasingly, governments, regulators and tax authorities are paying closer attention to how wealth is held and transferred. That means families cannot afford to adopt a “set-and-forget” approach to their structures.
The families who will be best placed for the future are not necessarily those with the greatest wealth.
They are the families with the greatest clarity. Clarity around ownership, succession and governance. And clarity around how wealth will transition from one generation to the next.
Ultimately, preserving wealth is not about avoiding change.
It is about preparing for it.
Because the greatest risk is not change itself.
It is losing the ability to respond to it.
Anthony Hunt is Co-Founder of Wealth Lawyers and former COO of Westpac Private Bank. He advises business owners, investors and affluent Australian families on wealth protection, succession planning and intergenerational wealth transfer

Travellers are swapping traditional sightseeing for immersive experiences, with Africa emerging as a must-visit destination.

A resurgence in high-end travel to Egypt is being driven by museum openings, private river journeys and renewed long-term investment along the Nile.