How Much Should Your Clothes Cost?
As the cost of living skyrockets, many shoppers are paying extra-close attention to the price of everything from denim to cashmere. We break down what it’s reasonable to pay for four quiet, high-quality menswear staples that will last.

 5 min
5 min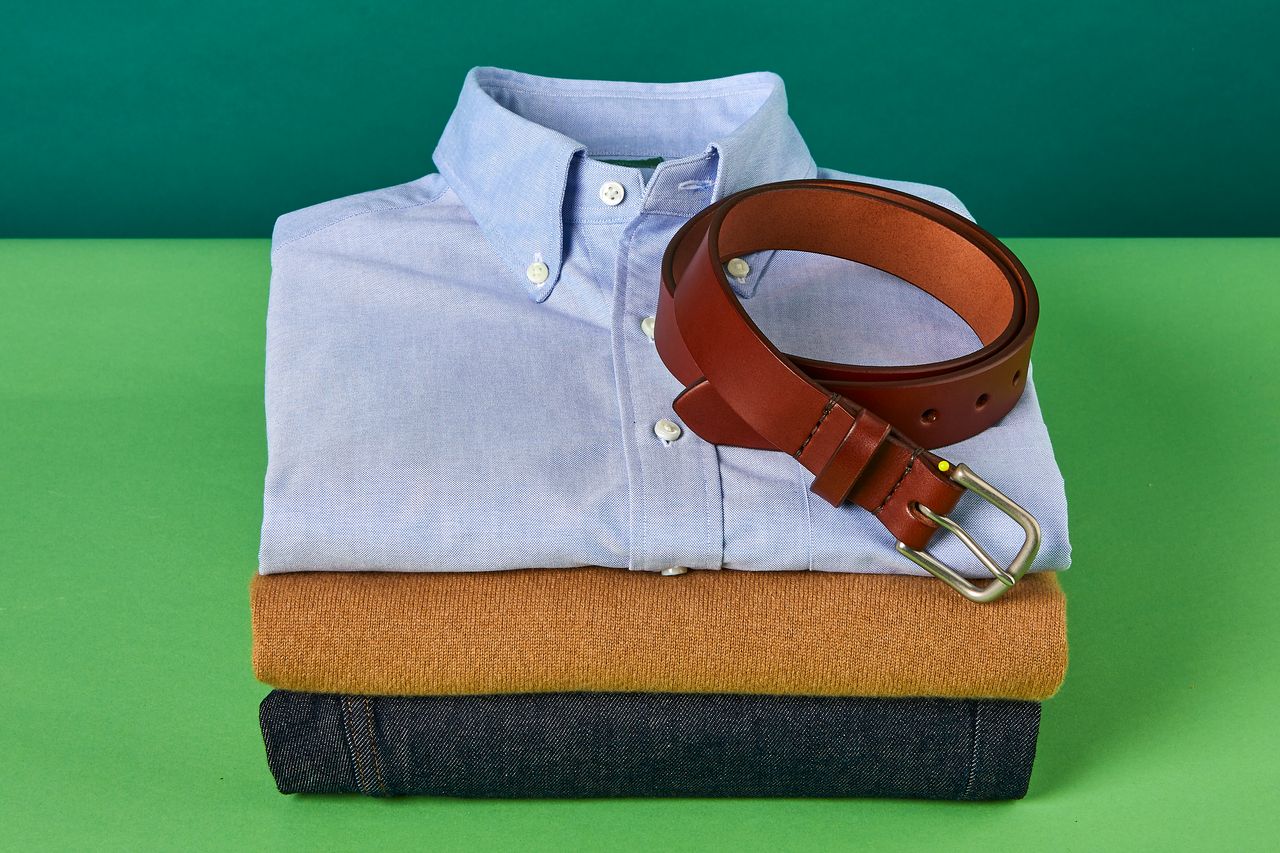
WITH INFLATION at record highs and a possible recession looming, shoppers are scrutinizing clothing price-tags hard right now. Few will welcome what they’re about to see, said Margaret Bishop, a supply-chain expert who teaches at three top fashion schools in New York. “The cost of raw materials, labor and transport, and logistics have all risen…and I don’t see how we could avoid higher retail prices in 2023,” she said.
Even so, you needn’t get ripped off. If you want quiet, well-made items that will last—and you don’t require a hyped brand name or luxury logo, both of which hike up prices—how much should you expect to shell out? Here, we do the math for four wardrobe staples.
1. Cashmere Sweater
Look to pay: $325 and above
Much of the world’s cashmere comes from Mongolia, but not all cashmere goats’ shags are created equal. An all-important, industry-wide grading system delineates fibers according to length and width. Grade A denotes the finest, longest and most expensive cashmere, which creates the softest and most-durable sweaters. Fast-fashion brands peddling sub-$100 knits tend to use Grade B or C hairs, meaning they’re shorter, scratchier and more liable to pill and break down over time, said Edouard Leret, co-founder of New York cashmere brand Leret Leret.
If you crave a cozy sweater with stamina, Grade A is the way to go. But determining the hair pedigree of a prospective purchase isn’t exactly easy: In the U.S., brands aren’t obligated to list grades on tags—“100% cashmere” is no guarantee you’re getting top-quality fuzz. A good workaround? Look to brands that specify Grade A on their websites, and shop for sweaters in-person so you can feel for softness, a telltale sign. Grade A creations needn’t cost eye-watering, four-figure sums. Some brands manage costs by producing close to the cashmere source. Leret Leret, for instance, manufactures in Mongolia, “which allows us to sell at the price we do,” said Mr. Leret. His playful knits are emblazoned with contemporary artists’ designs and start at $475. Simpler sweaters will be cheaper still. Massachusetts brand Billie Todd is a good benchmark: Its unfussy crew necks, which use Grade A fibers spun at a leading Scottish mill, start at $325.
A soft, subdued cashmere knit
- Knit in Scotland, it features a ribbed, sag-resistant neck.
- Solid, ribbed trim at the cuffs and waist refuses to lose shape.
- Grade-A cashmere—the softest, most-durable variety. Sweater, $325, BillieTodd.com
2. Oxford Shirt
Look to pay: $125 (or $175 for made-in-the-U.S.)
“A basic Oxford is pretty simple,” said Atlanta designer Sid Mashburn. What separates a prize button-up from a flimsier, forgettable one are nuances related to construction and finish. Brands make a calculated decision about how much their customer cares about these price-increasing details. For instance, Mr. Mashburn’s shirts are sewn with 22 stitches per inch as opposed to the standard 16. This more time-intensive construction results in a sturdier, more-polished product. Other features to consider: Are the buttons made from cheap plastic or lustrous trocas shell? Is the collar blessed with an inner lining that softens pleasingly over time or is it a cheaper, “fused” collar that remains rigor-mortis-stiff forever?
Mr. Mashburn’s Oxfords, which feature many such nice-to-haves, will set you back $125. He’s able to sell them for this amount—a reasonable sum considering the quality—because they’re sewn in Honduras, where manufacturing costs are lower than in the U.S. and much of Europe.
If you desire a made-in-the-U.S. shirt, prepare to cough up about $50 more. Philip Saul, owner of Boston store Sault New England, produces his shirts a mere 50 miles away in Fall River, Mass. They feature premium details similar to Mr. Mashburn’s but cost $178. “The same workers that make maybe $18 an hour were maybe getting $8 an hour 10 years ago, so it makes sense that quality, made-in-America things should cost more [now],” said Mr. Saul. When manufacturing costs for an item go up $5, he added, “the retail price goes up $10.”
An Oxford shirt with thoughtful details
- A nicely rolled collar not a forever-stiff ‘fused’ variety.
- Pearly, trocas-shell buttons as opposed to plastic versions.
- 22 stitches per inch—sturdier than the standard 16 stitches. Shirt, $125, SidMashburn.com
3. Jeans
Look to pay: $100 for a megabrand, under $300 for an independent maker
All jeans begin with more or less the same quality cotton, but this seemingly simple raw material boasts “one of the most complex. supply chains because it’s so global,” said Ms. Bishop, the professor. Cotton is often grown on one continent and spun on another, before it is transformed into a specific denim via a seemingly infinite choice of washes, blends and finishes—selvedge, vintage, raw, bleached, stretch, you name it. The deluge of jeans styles makes it tricky to determine a universal standard for quality and value, said Aaron Levine, a designer who consults for brands including Aimé Leon Dore and Vince and was formerly senior vice president of men’s and women’s design at Abercrombie & Fitch. The quality of rivets and zippers, and presence of flourishes like embroidery, nudge up the cost, he added.
Arguably a bigger price determinant: the size of the denim brand. “[Household brands] have such massive economies of scale that they receive price breaks on both raw materials and manufacturing,” said Mr. Levine. Such breaks are seldom extended to smaller brands, he said, which is why jeans from independent labels often cost more than, say, Levi’s or Wranglers.
When assessing a potential purchase, Mr. Levine asks himself: “Does the fabric feel like it’s got guts and integrity? Is the stitching straight and even?” Though he might splurge on tough-to-find vintage jeans, he has hard limits when buying new styles. “[Even] if a pair of new jeans fits me perfectly, I won’t go over $300.”
A solid pair of jeans from a big-name brand
- Mid-weight denim washed using less water foreco reasons.
- Precise, even stitching is a sign of quality jeans. Jeans, $98, Everlane.com
4. Leather Belt
Look to pay: $100 max
A great belt can cost $100 or even less. At around that price point, you can get leather of sufficient quality that you see the grain and, when you touch it, “you feel ‘leather’—not plastic or enamel or any finishes,” said Yuki Matsuda, the founder of Los Angeles fashion brands Monitaly and Yuketen. Because it’s rarely complicated to make a belt, raw materials usually account for the bulk of the final price. “Most of [that] goes into the leather. but buckles can incur really wild prices,” said Mr. Matsuda, if they’re a masterfully handcrafted creation rather than a basic brass design.
For some of the best—and best-priced—belts, Mr. Matsuda advises seeking out seasoned, small-scale brands. One such standout: Narragansett Leathers in Damariscotta, Maine, whose owner, Alan McKinnon, has handmade vegetable-tanned, bridle-leather belts since 1969. “When I first started [my most popular models] were $7 and now they are $55, 50 years later,” said Mr. McKinnon.
Can’t make it to a one-man shop in Maine for your new cincher? Visit independent retailers closer to home and peruse their in-house lines. Sault, the Boston retailer, makes agreeably understated belts at a nearby factory; they cost $89 a pop.
A handsome belt featuring first-rate leather and a no-nonsense, stainless-steel buckle
- Hand-stitching around the buckle is straight and even.
- English bridle leather with some graininess—not overly smooth. Belt, $89, SaultNE.com
Blue Buys
We asked men in Midtown Manhattan what they’d fork over for a pair of jeans.
“Probably, like, $50. I love to thrift—that’s where I find most of the jeans I like.”
—Dalton Bleckman, 19, student
“Up to $200. It depends on the occasion, what I’m wearing it for. [I’ll] go down to $40-60 but if it’s a name brand I’ll go up.”
—Frank Henderson, 62, works on convertible bonds desk
“100 bucks, 150 maybe. I like Levi’s. I think this pair [I’m wearing] are from Uniqlo. They’re quite cheap: 30-40 euros.”
—Tommaso Noseda, 32, consultant
“120 bucks. I like AG and Diesel. These [ones I’m wearing] are Zara, [they cost] under 60 bucks, probably.”
—Yoni Ron, 37, works in software sales
 Copyright 2020, Dow Jones & Company, Inc. All Rights Reserved Worldwide. LEARN MORE





From making unpopular decisions to learning when to listen, leaders from five businesses reveal what nobody prepared them for — and how running a company has challenged their expectations.

Technology and semiconductor shares fell sharply as investors questioned the debt financing the AI infrastructure boom and confronted higher rates and Chinese competition.

Technology and semiconductor shares fell sharply as investors questioned the debt financing the AI infrastructure boom and confronted higher rates and Chinese competition.
4 minA sharp technology sell-off has exposed a new anxiety on global markets: whether the enormous borrowing behind the artificial-intelligence infrastructure boom can generate sufficient returns as interest rates rise and Chinese competition intensifies.
The artificial-intelligence investment boom has powered technology shares, semiconductor manufacturers and data-centre operators to extraordinary heights. Last week, investors were given a reminder that much of this expansion is being built with borrowed money.
The technology-heavy Nasdaq Composite fell 4.5 per cent over the week ended October 16, its weakest performance since late June. Semiconductor shares suffered an even deeper correction, with the Philadelphia Semiconductor Index losing about 11.4 per cent.
The selling spread quickly through global markets. Micron Technology fell 14.6 per cent over the week, while South Korea’s Samsung Electronics and SK Hynix dropped approximately 18 per cent and 24 per cent respectively.
This was more than a routine bout of profit-taking. Investors were reassessing three interconnected risks: higher interest rates, the rapidly expanding debt burden attached to AI infrastructure and the prospect of stronger competition from Chinese memory-chip manufacturers.
The debt behind the AI build-out
Artificial intelligence requires a physical infrastructure network of enormous scale. Data centres must be built, advanced processors purchased, power supplies secured and cooling systems installed before customers begin generating meaningful revenue from them.
Technology companies are increasingly supplementing their own cash with corporate bonds, syndicated loans, equipment leases, private credit and project-level financing.
JPMorgan describes the emerging funding model as a combination of conventional corporate borrowing and project finance tied to individual data-centre assets. In Australia, the Reserve Bank estimates that syndicated loans accounted for approximately three-quarters of data-centre financing during 2025 and 2026 to date.
The numbers are becoming large enough to affect broader credit markets. The Federal Reserve Bank of Dallas has cited Wall Street estimates suggesting AI-related investment-grade bond issuance could approach US$300 billion in 2026 alone.
That borrowing is not automatically problematic. Debt can be an efficient way to finance long-lived infrastructure when future revenue is sufficiently predictable. The concern is that AI technology, customer demand and computing economics are changing much faster than the repayment schedules attached to the assets.
A data centre financed today may carry debt for years. Investors must therefore make assumptions about future utilisation rates, electricity prices, chip performance, customer concentration and the amount businesses will ultimately pay for AI computing.
When interest rates rise, those assumptions become less forgiving.
Inflation changes the calculation
September’s US inflation data intensified the pressure. Consumer prices increased 3.7 per cent over the year, ahead of market expectations and up from 3.4 per cent in August.
The hotter reading reduced confidence that interest rates would fall quickly and pushed bond yields higher. That matters particularly for companies whose valuations depend on profits expected well into the future, as well as highly leveraged infrastructure operators that may need to refinance.
CoreWeave has emerged as a closely watched test case. The specialist cloud-computing company has accumulated substantial debt and lease obligations to build AI capacity, while relying on a concentrated group of large technology customers.
Its shares fell sharply during the sell-off, while the cost of insuring its debt against default climbed. CoreWeave has argued that its contracted backlog more than covers its obligations and that financial markets do not always understand its business model. Nevertheless, its securities have become a proxy for investor confidence in debt-funded AI infrastructure.
Oracle, another major investor in AI computing capacity, fell 8.8 per cent in Friday trading, while CoreWeave dropped 15.5 per cent.
The question is shifting from how much AI infrastructure can be built to how profitably it can be operated.
China adds another source of pressure
Interest rates were not the only catalyst. Reports of advances by Chinese memory-chip producer ChangXin Memory Technologies raised concerns that lower-cost Chinese products could increase competition across the global semiconductor industry.
Memory chips are essential to AI systems, but the industry is historically cyclical. Periods of tight supply and high pricing can encourage rapid investment, eventually producing oversupply and falling margins.
The prospect of a well-funded Chinese competitor expanding its technological capabilities unsettled investors in Samsung, SK Hynix and Micron. It also demonstrated that AI-related demand does not insulate chipmakers from conventional competitive pressures.
That combination—slower rate cuts, more expensive financing and potentially cheaper supply—challenged the assumption that every company exposed to AI would enjoy continually expanding margins.
A reset rather than the end of the boom
The sell-off does not establish that the AI boom is ending. Demand for computing power remains strong, the largest technology companies continue to generate formidable cash flows and many infrastructure projects are backed by long-term customer contracts.
What has changed is the market’s willingness to overlook the price and financing structure of that growth.
The most resilient companies are likely to be those able to fund investment from operating cash flow, secure long-duration customers and demonstrate that new capacity will earn returns comfortably above its financing costs.
More speculative operators may face greater scrutiny, particularly where debt is expensive, customers are concentrated or expected revenue depends on demand that has not yet materialised.
For Australian investors, the lesson extends beyond US technology shares. Local data-centre operators, infrastructure funds, electricity suppliers and property groups are increasingly exposed to the same investment cycle.
Artificial intelligence may remain one of the defining growth themes of the decade. But last week’s correction showed that enthusiasm for the technology does not eliminate financial discipline.
The next stage of the AI boom will be judged not only by computing power, model performance or demand for chips, but by something more traditional: whether the assets being financed can generate enough cash to repay the money borrowed to build them.
Fact box
Nasdaq Composite: Down 4.5 per cent for the week ended October 16, 2026
Philadelphia Semiconductor Index: Down approximately 11.4 per cent
Micron Technology: Down approximately 14.6 per cent
Samsung Electronics: Down approximately 18 per cent
SK Hynix: Down approximately 24 per cent
US September inflation: 3.7 per cent annually
Estimated 2026 AI-related investment-grade issuance: Approximately US$300 billion

ABC Bullion has launched a pioneering investment product that allows Australians to draw regular cashflow from their precious metal holdings.
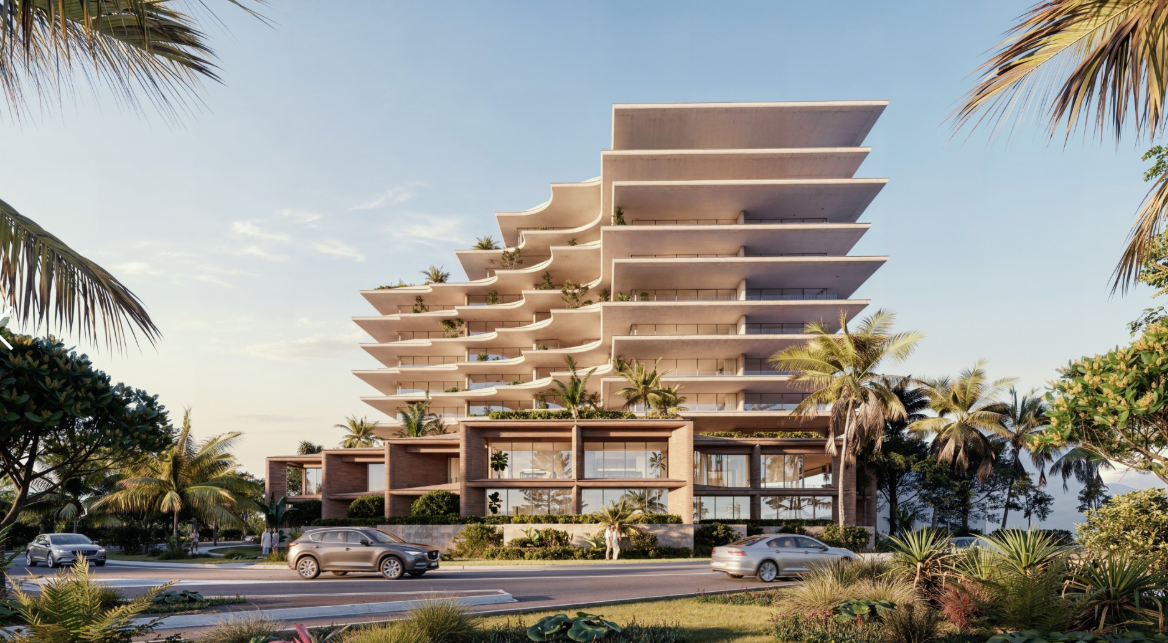
Queensland-based builder-developer MAYD has unveiled an exclusive first look at its anticipated ultra-luxury North Kirra mixed-use project as it lodges a minor amendment with the City of Gold Coast Council. The project sits across a 4,742sqm amalgamated landholding spanning seven parcels at 2–6 Pacific Parade and 27–33 Golden Four Drive, Bilinga, which MAYD secured in …
Continue reading “MAYD”s North Kirra Plans Unveiled Ahead of Early 2027 Launch”