I Cancelled My Unused Subscriptions. The Money I Saved Paid for a Tesla.
A close look turned up a car’s worth of savings I didn’t know existed
My new Tesla was burning a $511 hole in my monthly budget. So I set myself a challenge: Could I cover the cost just by getting rid of cable, Netflix and other subscriptions I didn’t need?
The financially responsible among us might cancel streaming services between seasons of their favourite shows . I tend to add new ones and forget about the old ones, doing my share to support America’s ballooning subscription economy. People pay about $273 a month for subscriptions, which is almost $200 more than they think they do, according to a 2021 survey . (Since then, services like Disney+ and Discovery+ have raised their prices further.)
But I needed to make room for the first car payment in my 41 years. I had taken the family car-shopping when our 2001 Toyota Camry, which we inherited from my wife’s grandmother, started to go. I’m not a car guy and had never once wished I’d owned a Tesla. I booked a demo drive for the Model Y because I thought our kids would get a kick out of it.
The fact that we liked the car was almost as surprising as the fact that it was cheaper than the electric Volvo, Volkswagen and Hyundai options we saw. It felt like a spaceship compared with the Camry, which has 205,000 miles, a broken tape deck and an interior stained with blue and yellow crayon.
Our new monthly payment covered a 12,000-miles-a-year lease with no down payment. Tesla estimated I would save about $100 a month from replacing gas with electric, though I would need to drive (and charge) the car to know for sure. Tesla’s app tracks my estimated savings. For now, that left us with $411 to cut from our other monthly expenses.
My wife was on board. My kids shrugged. I got out my notebook and started making a list.
Cutting the cord
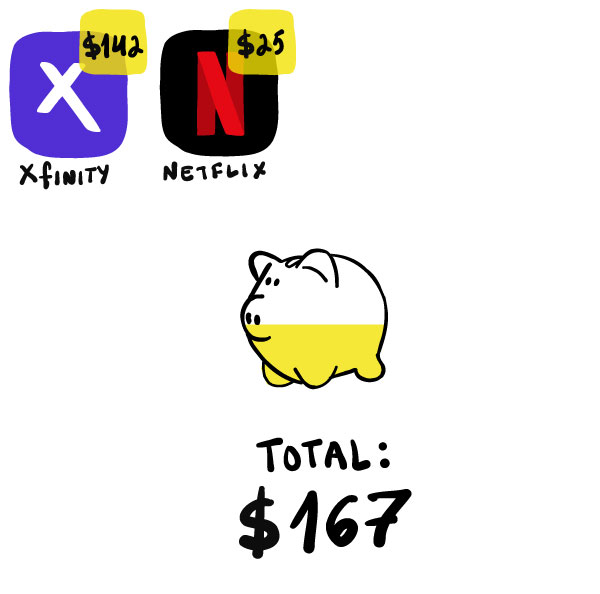
My first stop was my Xfinity bill.
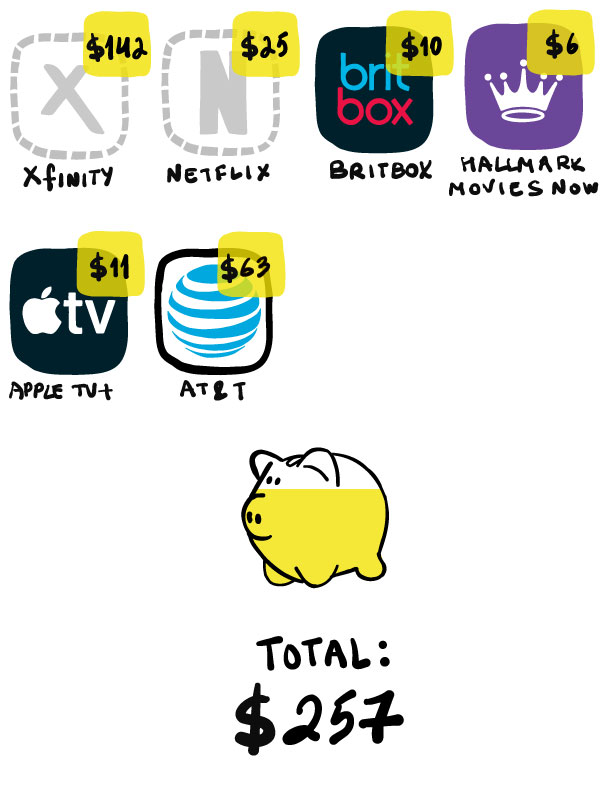
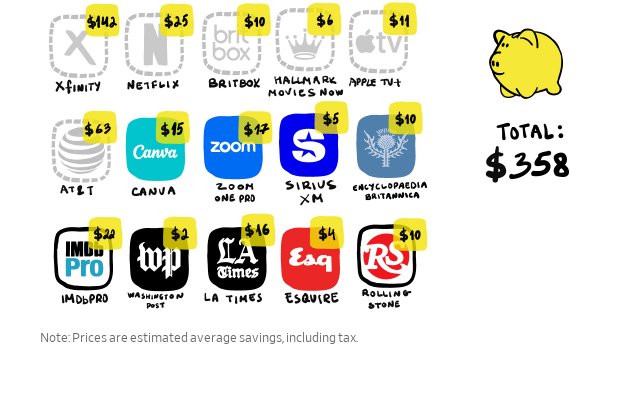
Somehow, it had swelled to $249 a month—basically half the price of the car. In addition to cable and internet, I’d been paying Xfinity for things like a landline because cell service can be spotty in my basement office. So long, landline. After cutting everything but internet, my bill fell to $107. I haven’t dropped a call yet.
Next were the streaming services that I’d been paying for but not watching much. Over the past few years, the only person in the house “watching” Netflix was me. And I wasn’t actually watching it. I was listening to episodes of “Seinfeld” in an earbud when I went to bed. The jokes and the rhythm of their back-and-forths were a pleasant send-off as I fell asleep.

I had joined the growing number of Americans ditching streaming services. I also broke up with BritBox, a streaming service that I’d counted on to watch Agatha Christie’s “Poirot,” as well as Apple TV+. I said goodbye to Hallmark Movies Now, which I’m not ashamed to admit I enjoyed every now and then.
Next up was AT&T .
Paying for cellphone service is like paying the water bill: something I did without protest and never really thought twice about. But I’d started to get curious about the ads I’d been seeing for low-cost services like Boost Mobile and Cricket Wireless. When we agreed to let our 13-year-old son have a phone, part of the deal was that he had to pay for and maintain the account himself. He got a plan with Mint Mobile. It has worked so well for him that we decided to give it a try.
We had been paying AT&T about $128 a month for two lines. Now, we’re paying Mint about $65. If there is a downside to making this move, I have yet to notice it.

I’m still paying for that?
Then my wife and I sat at our dining table going through the last couple months of transactions in our checking account. Seeing how much money we were wasting was painful. We were both paying for subscriptions to Canva, a graphic-design service.
We’ve also been paying for Zoom One Pro, which I probably haven’t used in more than a year. I attempted canceling SiriusXM, but they kept me around by dropping the cost by about $5 a month, which is nice because I have become obsessed with a channel dedicated to country artist and sometimes actor Dwight Yoakam.
Upon further consideration I axed subscriptions to IMDbPro and Encyclopaedia Britannica, which I’m sure I’ve used professionally, but…not for a while. Finally, I cut or got reduced rates on four of my digital subscriptions to news publications. I had been making monthly payments to them more often than I was reading them.

In the end, I was able to cut out about $358 in unnecessary bills and subscriptions. Added to the $100 in estimated gas savings, the cost dropped to $53 for a car we desperately needed.
And since the lease came with six months of free access at Tesla Superchargers, the Tesla app tells me I saved $164 by not pumping gas in January, exceeding the $100 I had estimated. In January at least, my car was free-ish.
“So I love and I hate what you did,” David Bach told me. The author of personal finance books like “Smart Couples Finish Rich” has long preached the merits of cutting out small, fixed expenses. But he’d rather have seen me invest the savings.
“If you’re already a millionaire, go enjoy the Tesla,” he said.
No regrets
It isn’t like we’ve had to revert to our DVD collection to entertain ourselves. We still have Disney+, Hulu, Max, the language-learning service Duolingo and, of course , Spotify. We get three print newspapers delivered and many more digital news subscriptions.
I’m reacquainting myself with some shows on the services I kept, like Billy Bob Thornton’s “Goliath” on Prime Video—featuring an exceptional performance from Dwight Yoakam.
It is possible we’ll start subscribing all over again. Americans resubscribe to about 23% of the larger streaming services they cut within three months. That share rises to over 40% after a year, according to Antenna, a subscription-analytics provider.
I get it. I subscribed to Paramount+ for Super Bowl Sunday (yes, I canceled it the following Tuesday). And I’m tempted to return to Netflix every time I get ready for bed. I still haven’t found a lullaby to replace “Seinfeld,” but at least I am the master of my (financial) domain.
I need something upbeat but not preachy, familiar, but with enough episodes that I don’t get too sick of them. I tried “Bob’s Burgers,” but Louise Belcher’s screams and the high-pitched strumming of the ukulele between scenes kept me awake.
Oh well. Reliable transportation is worth the $511 monthly payment. Come to think of it, that feels a lot like a subscription.
 Copyright 2020, Dow Jones & Company, Inc. All Rights Reserved Worldwide. LEARN MORE
This stylish family home combines a classic palette and finishes with a flexible floorplan
Just 55 minutes from Sydney, make this your creative getaway located in the majestic Hawkesbury region.
Continued stagflation and cost of living pressures are causing couples to think twice about starting a family, new data has revealed, with long term impacts expected
Australia is in the midst of a ‘baby recession’ with preliminary estimates showing the number of births in 2023 fell by more than four percent to the lowest level since 2006, according to KPMG. The consultancy firm says this reflects the impact of cost-of-living pressures on the feasibility of younger Australians starting a family.
KPMG estimates that 289,100 babies were born in 2023. This compares to 300,684 babies in 2022 and 309,996 in 2021, according to the Australian Bureau of Statistics (ABS). KPMG urban economist Terry Rawnsley said weak economic growth often leads to a reduced number of births. In 2023, ABS data shows gross domestic product (GDP) fell to 1.5 percent. Despite the population growing by 2.5 percent in 2023, GDP on a per capita basis went into negative territory, down one percent over the 12 months.
“Birth rates provide insight into long-term population growth as well as the current confidence of Australian families,” said Mr Rawnsley. “We haven’t seen such a sharp drop in births in Australia since the period of economic stagflation in the 1970s, which coincided with the initial widespread adoption of the contraceptive pill.”
Mr Rawnsley said many Australian couples delayed starting a family while the pandemic played out in 2020. The number of births fell from 305,832 in 2019 to 294,369 in 2020. Then in 2021, strong employment and vast amounts of stimulus money, along with high household savings due to lockdowns, gave couples better financial means to have a baby. This led to a rebound in births.
However, the re-opening of the global economy in 2022 led to soaring inflation. By the start of 2023, the Australian consumer price index (CPI) had risen to its highest level since 1990 at 7.8 percent per annum. By that stage, the Reserve Bank had already commenced an aggressive rate-hiking strategy to fight inflation and had raised the cash rate every month between May and December 2022.
Five more rate hikes during 2023 put further pressure on couples with mortgages and put the brakes on family formation. “This combination of the pandemic and rapid economic changes explains the spike and subsequent sharp decline in birth rates we have observed over the past four years,” Mr Rawnsley said.
The impact of high costs of living on couples’ decision to have a baby is highlighted in births data for the capital cities. KPMG estimates there were 60,860 births in Sydney in 2023, down 8.6 percent from 2019. There were 56,270 births in Melbourne, down 7.3 percent. In Perth, there were 25,020 births, down 6 percent, while in Brisbane there were 30,250 births, down 4.3 percent. Canberra was the only capital city where there was no fall in the number of births in 2023 compared to 2019.
“CPI growth in Canberra has been slightly subdued compared to that in other major cities, and the economic outlook has remained strong,” Mr Rawnsley said. “This means families have not been hurting as much as those in other capital cities, and in turn, we’ve seen a stabilisation of births in the ACT.”
This stylish family home combines a classic palette and finishes with a flexible floorplan
Just 55 minutes from Sydney, make this your creative getaway located in the majestic Hawkesbury region.


