


Living Paycheck to Paycheck Is Common, Even Among Those Who Make More Than $100,000

 3 min
3 min, caption: About 65% of working Americans report frequently living paycheck to paycheck, according to a Barron's survey of 2,105 U.S. adults conducted by The Harris Poll.")
Many Americans are living in financial distress, at least some of the time.
That’s the message of a recent Harris Poll, and it’s bad news for economic growth.
About 65% of working Americans say they frequently live paycheck to paycheck, according to a recent survey of 2,105 U.S. adults conducted by The Harris Poll, asking questions supplied by Barron’s. About 30% of households report that they run out of money at the end of every month, while 35% say they don’t have money left at the end of most months.
While the number of people living on the edge financially has an immediate effect on household well-being, there are also longer term economic costs, including higher debt levels and uneven retirement readiness. Those trends could also dampen overall economic growth.
Unsurprisingly, people earning less tend to struggle more, but even those considered well off are vulnerable to paycheck shocks. About 78% of Americans earning less than $50,000 a year report they live paycheck to paycheck, according to the survey. Yet 51% of Americans who make more than $100,000 a year say they still run out of money.
Living paycheck to paycheck is a fairly “ubiquitous” circumstance, says Fiona Greig, Vanguard’s global head of investor research and policy. That’s because U.S. adults generally tend to need a bigger cash buffer than they anticipate. Additionally, she says, many consumers are facing higher living expenses as inflation erodes their purchasing power.
The latest Harris survey data show a higher percentage of Americans living paycheck to paycheck than the roughly 60% reported in August in the Reality Check: Paycheck-To-Paycheck research series. The difference likely is due to differences in the survey population, and rising energy costs that hit consumers’ budgets in recent weeks. At the end of September, gasoline averaged $3.83 a gallon nationally, two cents more than in August, and seven cents more than a year earlier, according to AAA.
Data from the Reality Check series have oscillated since the Covid pandemic started. About 66% of those surveyed in March 2020 said they were spending down their paychecks. Some 52% of Americans were in such straits in April 2021, shortly after the most generous round of federal stimulus checks went out. The latest share, at 60%, is little-changed from the prior year.
Although generous government stimulus programs boosted consumers’ savings during the Covid pandemic, those outlays have waned. The Federal Bank of San Francisco estimated that Americans accumulated $2.1 trillion in total excess savings during the pandemic. Only about $190 billion remained on consumer balance sheets as of June, the bank estimated.Researchers anticipate the data will show that excess savings were gone completely as of the end of September.
Overall inflation also has taken a toll, leaving Americans with less purchasing power. Although headline inflation, as measured by the Consumer Price Index, has fallen from a high of 9% recorded in June 2022, prices climbed at a 3.7% annual pace in September, well above the Federal Reserve’s desired 2% target.
Even as Americans draw down their savings, they aren’t refilling their coffers. The U.S. personal savings rate—the percentage of disposable personal income to total income—was 3.9% in August, according to the Bureau of Economic Analysis. While that is 0.7 percentage points higher than a year ago during a higher-inflation period, the current rate is well below prepandemic averages.
Diminished savings suggest Americans are relying on more credit now than during the pandemic, and data bear that out. Total U.S. credit-card debt hit a record of $1.03 trillion during the second quarter, according to the Federal Reserve Bank of New York.
A slower rate of savings and a higher level of borrowing have longer term consequences for many Americans. Vanguard’s research indicates that even with the influx of cash during the pandemic, the vast majority of Americans aren’t on track to meet their spending needs in retirement, and that’s after including Social Security income and private savings. The problem is particularly acute for lower-income families.
Social Security benefits replace about 62% of the retirement income that families earning roughly $22,000 a year need once they no longer are working, Vanguard reported. Yet even higher-income Americans rely on Social Security. Families earning about $173,000 a year draw about 18% of their retirement income from Social Security, according to Vanguard.
Social Security is inflation-protected, but cost-of-living adjustments affect the amount of benefits paid, and as a result, impact the program’s projected long-term solvency. Social Security benefits are set to rise 3.2% for 2024, increasing the average monthly payment of $1,790 by $57.
The high percentage of financially vulnerable Americans, whether working or retired, poses broader problems. Consumer spending accounts for about 70% of the U.S. economy. If Americans pull back on their household spending because they need to pay interest on their credit cards or loans, or because they don’t have enough saved to live in retirement, that could impact the nation’s growth.
So far, most Americans have kept up with their debt payments while continuing to spend. Overall delinquencies were largely in check as of the second quarter.
The robust labour market has helped: The U.S. economy added 336,000 jobs in September, well above expectations. Even so, the imbalance between labour demand and supply continues to narrow, Fed Vice Chair Philip Jefferson said in a speech last Monday.
“We’re at kind of a turning point in our economy,” Greig says, noting that this could be an inflection point for consumers.
 Copyright 2020, Dow Jones & Company, Inc. All Rights Reserved Worldwide. LEARN MORE


This stylish family home combines a classic palette and finishes with a flexible floorplan

Just 55 minutes from Sydney, make this your creative getaway located in the majestic Hawkesbury region.
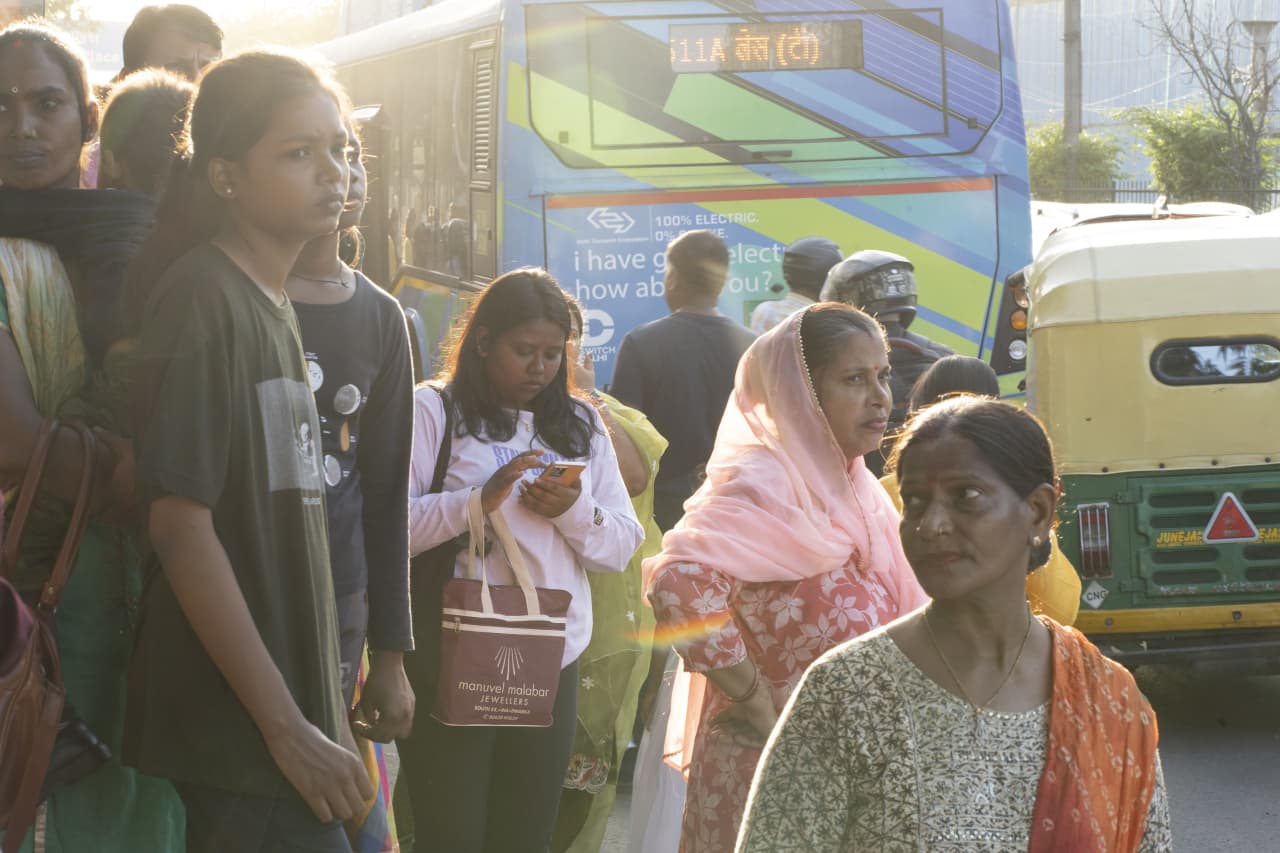
Governments around the world are offering incentives to reverse a downward spiral that could threaten economic growth
2 min
The Australian birth rate is at a record low, new data has shown.
Figures from the Australian Bureau of Statistics have revealed there were 286,998 births registered around the country last year, or 1.5 babies per woman.
Birth rates in Australia have been in a slow decline since the 1990s, down from 1.86 births per woman in 1993. Declining fertility rates among girls and women aged 15 to 19 years was most stark, down two thirds, while for women aged 40 to 44 years, the rate had almost doubled.
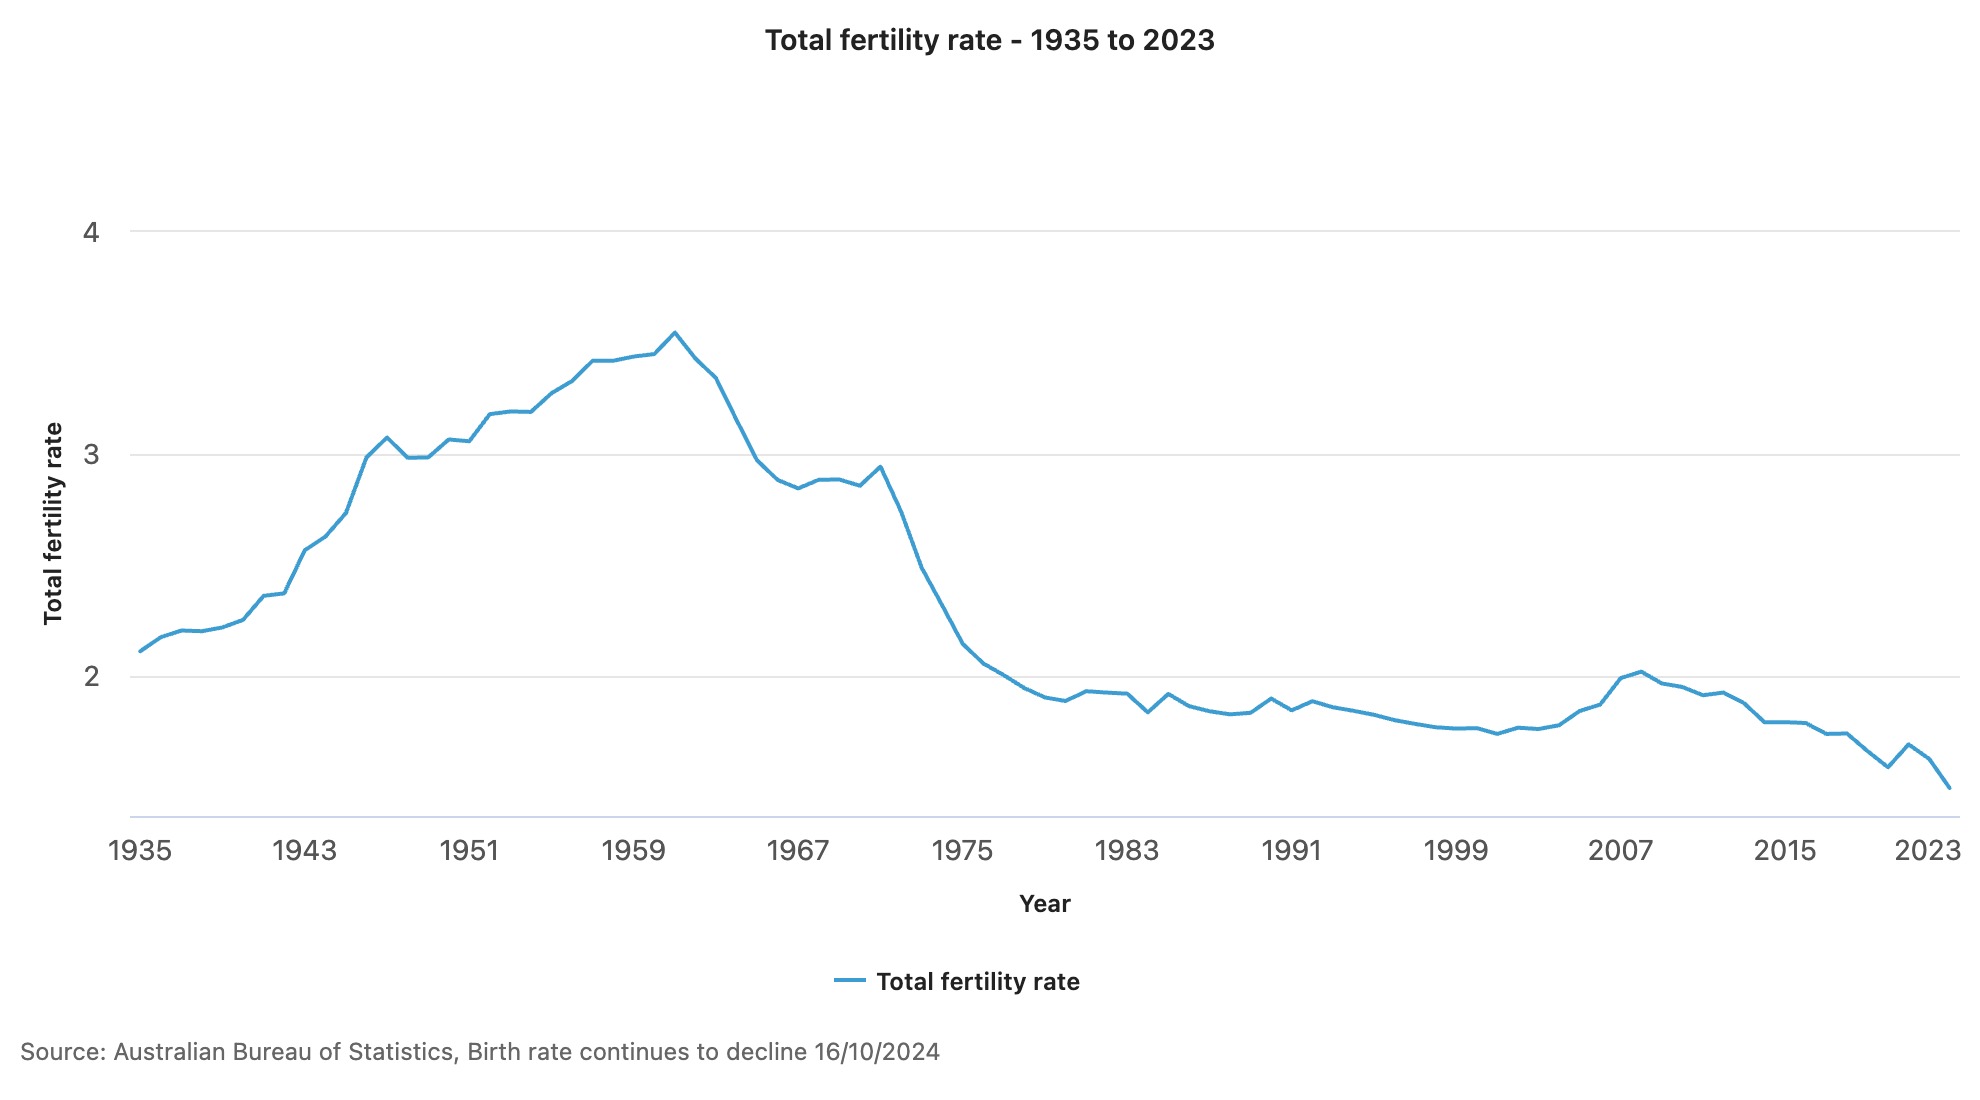
“The long-term decline in fertility of younger mums as well as the continued increase in fertility of older mums reflects a shift towards later childbearing,” said Beidar Cho, ABS head of demography statistics. “Together, this has resulted in a rise in median age of mothers to 31.9 years, and a fall in Australia’s total fertility rate.”
The fall in the Australian birth rate is in keeping with worldwide trends, with the United States also seeing fertility rates hit a 32-year low. The Lancet reported earlier this year that, based on current trends, by 2100 more than 97 percent of the world’s countries and territories “will have fertility rates below what is necessary to sustain population size over time”.
On a global scale, the Lancet reported that the total fertility rate had “more than halved over the past 70 years” from about five children per female in the 1950s to 2.2 children in 2021. In countries such as South Korea and Serbia, the rate is already less than 1.1 child for each female.
Governments around the world have tried to incentivise would-be parents, offering money, increased access to childcare and better paid maternity leave.
Experts have said without additional immigration, lower birth rates and an ageing population in Australia could put further pressure on young people, threaten economic growth and create economic uncertainty. However, a study released earlier this year by the University of Canberra showed the cost of raising a child to adulthood was between $474,000 and $1,097,000.
This stylish family home combines a classic palette and finishes with a flexible floorplan
Just 55 minutes from Sydney, make this your creative getaway located in the majestic Hawkesbury region.