New York Watch Auctions Record Uptick in Sales in the Face of Market Slowdown

 4 min
4 min
Luxury watch collectors showed ongoing strong demand for Patek Philippe, growing interest in modern watches and a preference for larger case sizes and leather straps at the June watch sales in New York, according to an analysis of the major auctions.
Independent and neo-vintage categories, meanwhile, experienced declines in total sales and average prices, said the report from EveryWatch, a global online platform for watch information. Overall, the New York auctions achieved total sales of US$52.27 million, a 9.87% increase from the previous year, on the sale of 470 lots, reflecting a 37% increase in volume. Unsold rates ticked down a few points to 5.31%, according to the platform’s analysis.
EveryWatch gathered data from official auction results for sales held in New York from June 5 to 10 at Christie’s, Phillips, and Sotheby’s. Limited to watch sales exclusively, each auction’s data was reviewed and compiled for several categories, including total lots, sales and sold rates, highest prices achieved, performance against estimates, sales trends in case materials and sizes as well as dial colors, and more. The resulting analysis provides a detailed overview of market trends and performance.
“We still see a strong thirst for rare, interesting, and exceptional watches, modern and vintage alike, despite a little slow down in the market overall,” says Paul Altieri, founder and CEO of the California-based pre-owned online watch dealer BobsWatches.com, in an email. “The results show that there is still a lot of money floating around out there in the economy looking for quality assets.”
Patek Philippe came out on top with more than US$17.68 million on the sale of 122 lots. It also claimed the top lot: Sylvester Stallone’s Patek Philippe GrandMaster Chime 6300G-010, still in the sealed factory packaging, which sold at Sotheby’s for US$5.4 million, much to the dismay of the brand’s president, Thierry Stern . The London-based industry news website WatchPro estimates the flip made the actor as much as US$2 million in just a few years.
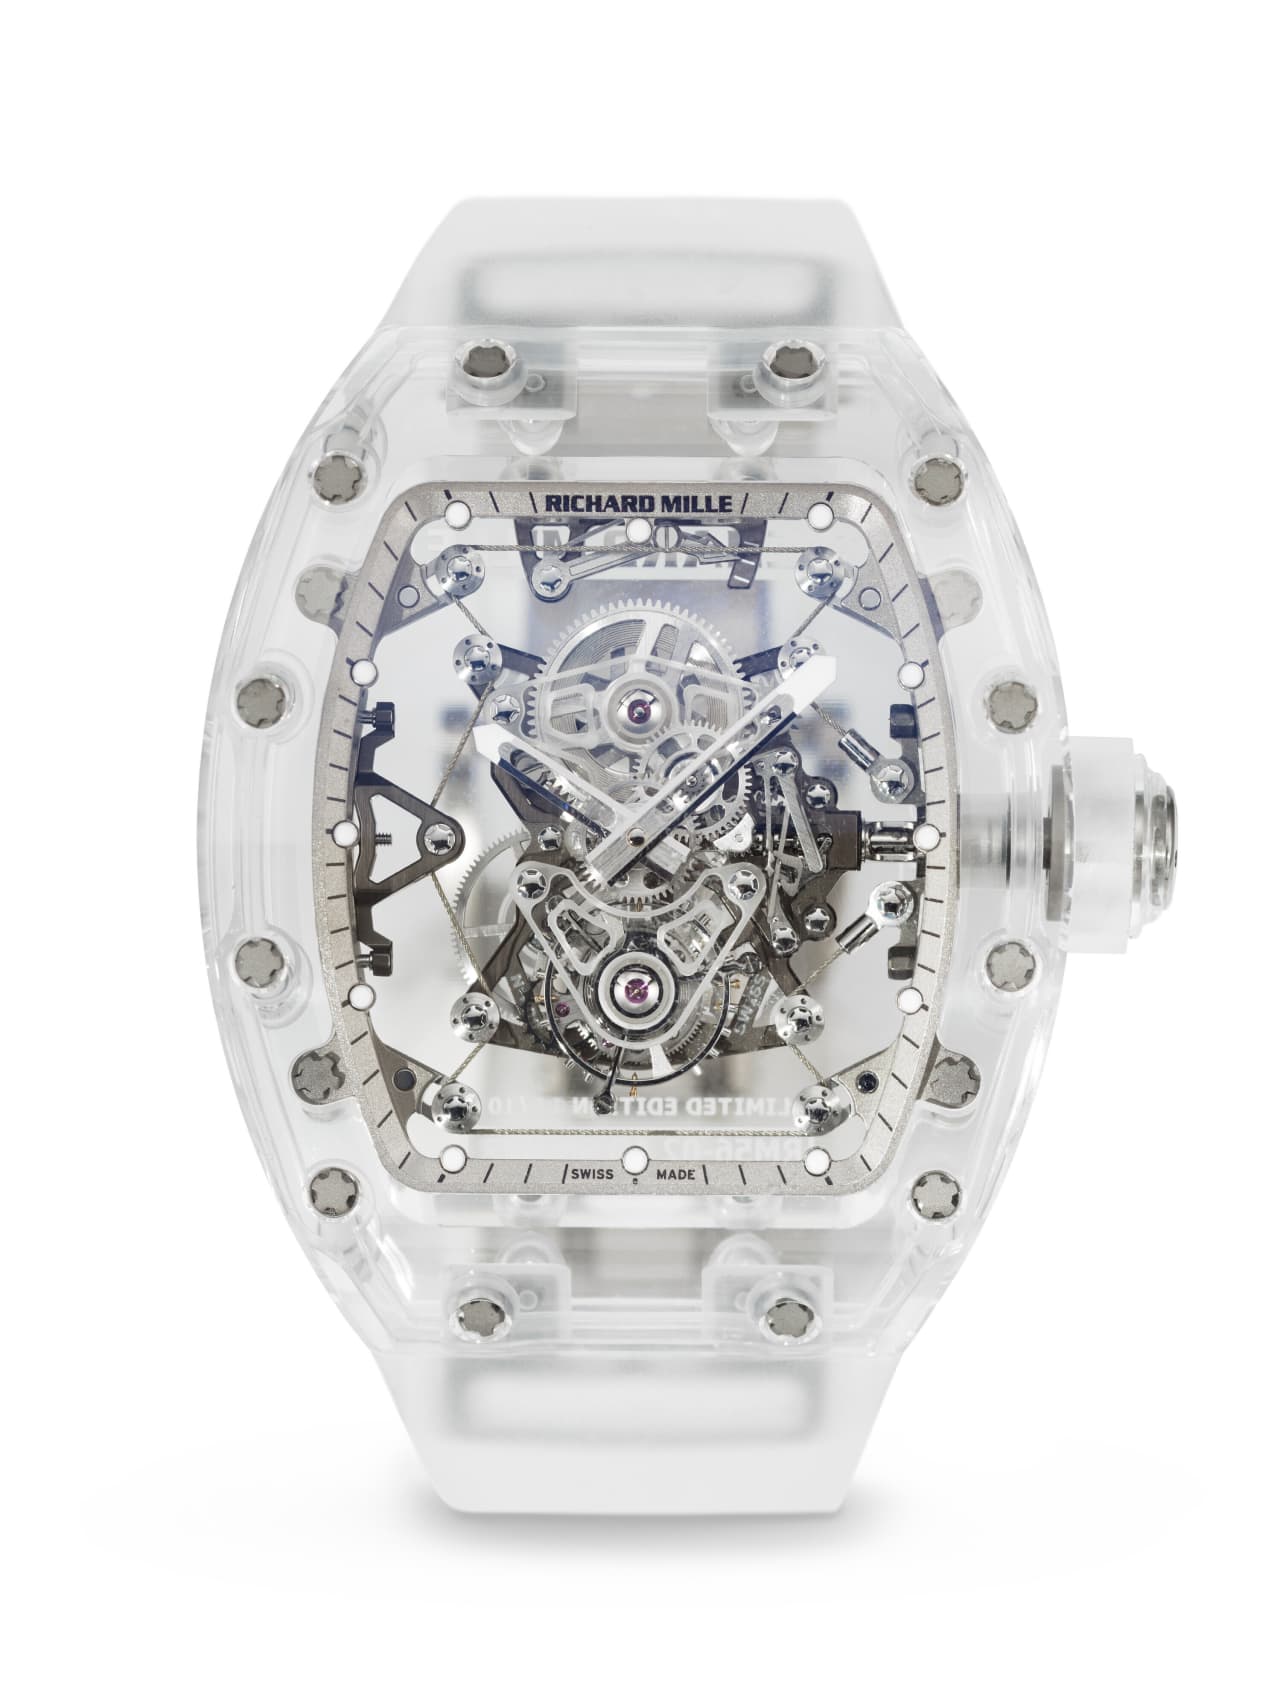
Richard Mille
“As we have seen before and again in the recent Sotheby’s sale, provenance can really drive prices higher than market value with regards to the Sylvester Stallone Panerai watches and his standard Patek Philippe Nautilus 5711/1a offered,” Altieri says.
Patek Philippe claimed half of the top 10 lots, while Rolex and Richard Mille claimed two each, and Philippe Dufour claimed the No. 3 slot with a 1999 Duality, which sold at Phillips for about US$2.1 million.
“In-line with EveryWatch’s observation of the market’s strong preference for strap watches, the top lot of our auction was a Philippe Dufour Duality,” says Paul Boutros, Phillips’ deputy chairman and head of watches, Americas, in an email. “The only known example with two dials and hand sets, and presented on a leather strap, it achieved a result of over US$2 million—well above its high estimate of US$1.6 million.”
In all, four watches surpassed the US$1 million mark, down from seven in 2023. At Christie’s, the top lot was a Richard Mille Limited Edition RM56-02 AO Tourbillon Sapphire, the most expensive watch sold at Christie’s in New York. That sale also saw a Richard Mille Limited Edition RM52-01 CA-FQ Tourbillon Skull Model go for US$1.26 million to an online buyer.
Rolex expert Altieri was surprised one of the brand’s timepieces did not crack the US$1 million threshold but notes that a rare Rolex Daytona 6239 in yellow gold with a “Paul Newman John Player Special” dial came close at US$952,500 in the Phillips sale.
The Crown did rank second in terms of brand clout, achieving sales of US$8.95 million with 110 lots. However, both Patek Philippe and Rolex experienced a sales decline by 8.55% and 2.46%, respectively. The independent brand Richard Mille, with US$6.71 million in sales, marked a 912% increase from the previous year with 15 lots, up from 5 lots in 2023.
The results underscored recent reports of prices falling on the secondary market for specific coveted models from Rolex, Patek Philippe, and Audemars Piguet. The summary points out that five top models produced high sales but with a fall in average prices.
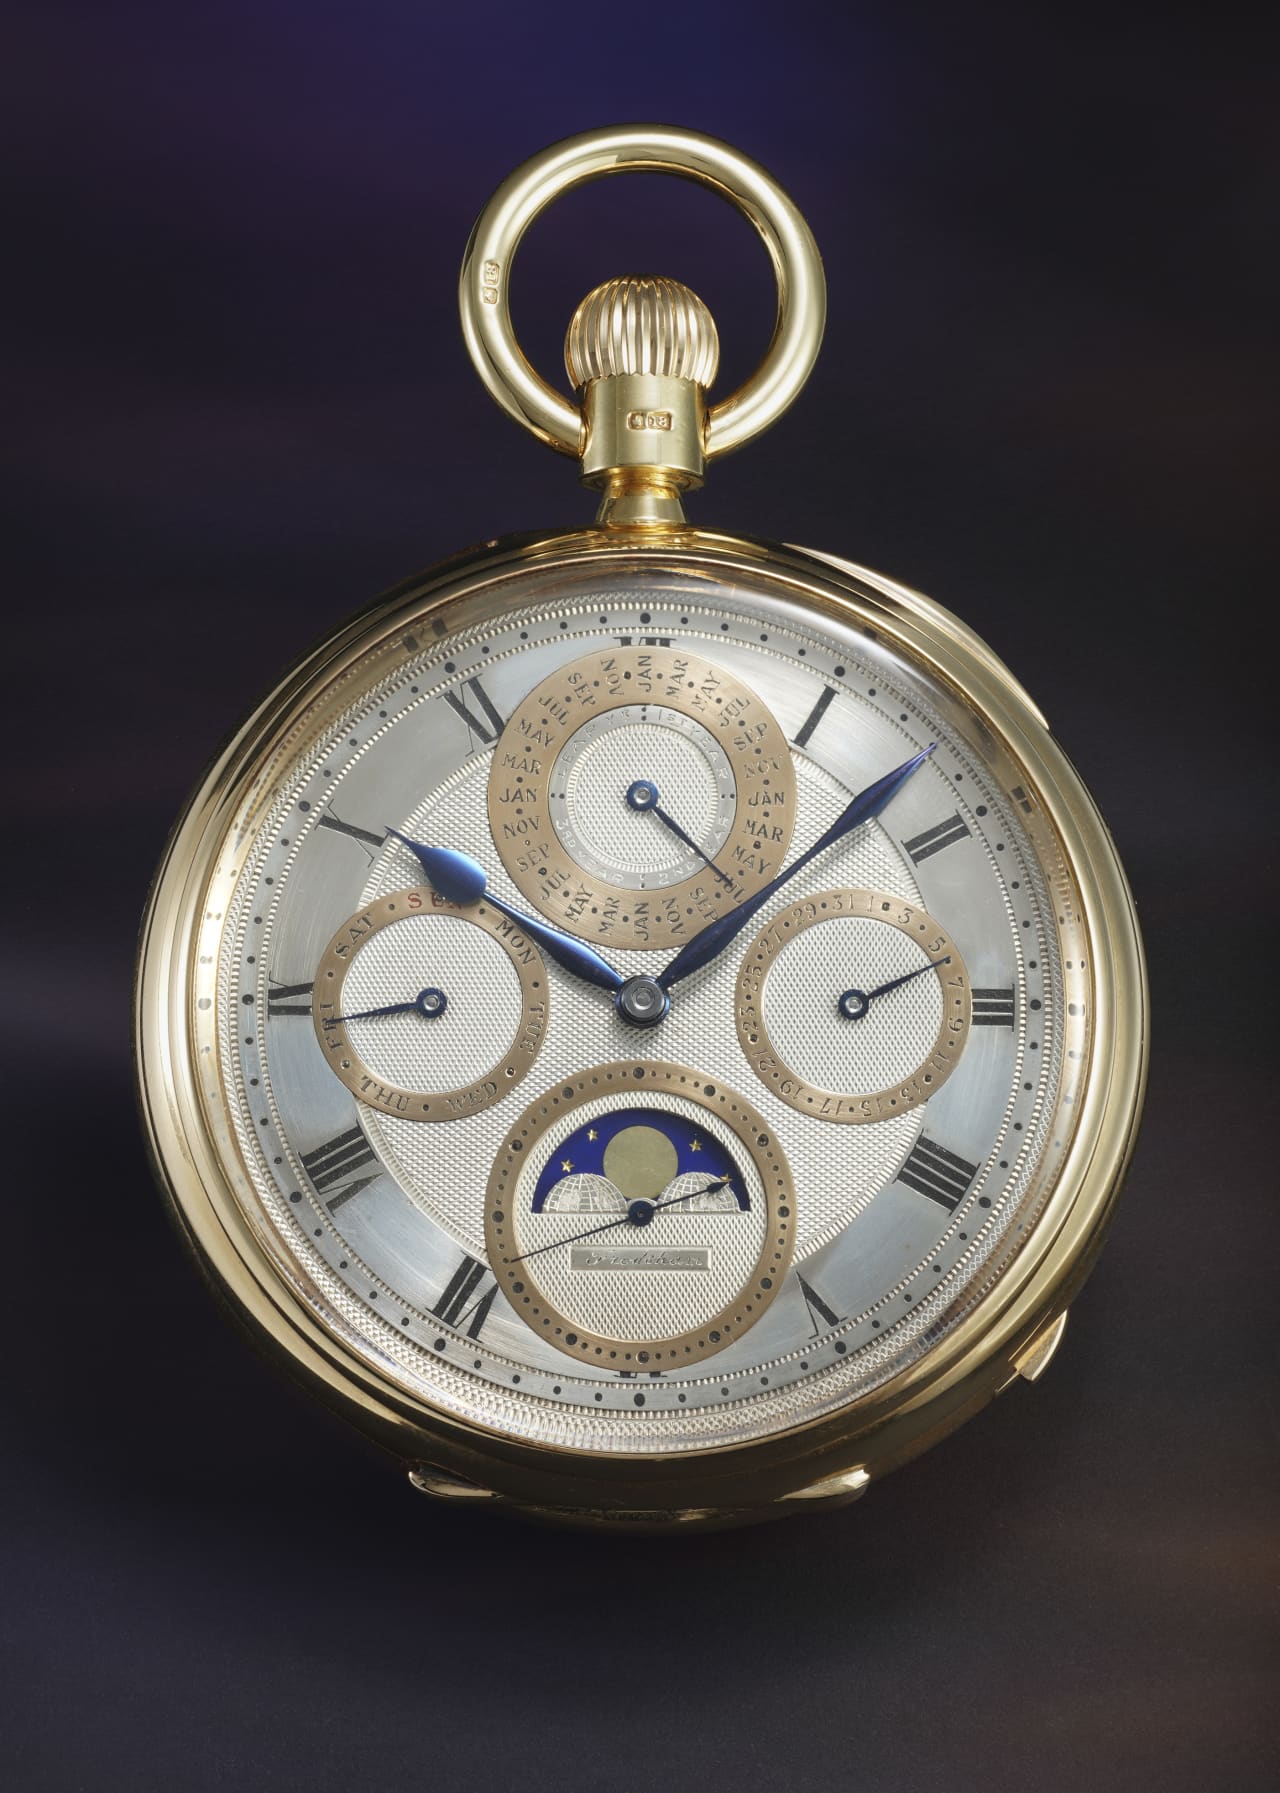
The Rolex Daytona topped the list with 42 appearances, averaging US$132,053, a 41% average price decrease. Patek Philippe’s Nautilus, with two of the top five watches, made 26 appearances with an average price of US$111,198, a 26% average price decrease. Patek Philippe’s Perpetual Calendar followed with 23 appearances and a US$231,877 average price, signifying a fall of 43%, and Audemars Piguet’s Royal Oak had 22 appearances and an average price of US$105,673, a 10% decrease. The Rolex Day Date is the only watch in the top five that tracks an increase in average price, which at US$72,459 clocked a 92% increase over last year.
In terms of categories, modern watches (2005 and newer) led the market with US$30 million in total sales from 226 lots, representing a 53.54% increase in sales and a 3.78% increase in average sales price over 2023. Vintage watches (pre-1985) logged a modest 6.22% increase in total sales and an 89.89% increase in total lots to 169.
However, the average price was down across vintage, independent, and neo-vintage (1990-2005) watches. Independent brands saw sales fall 24.10% to US$8.47 million and average prices falling 42.17%, while neo-vintage watches experienced the largest decline in sales and lots, with total sales falling 44.7% to US$8.25 million, and average sales price falling 35.73% to US$111,000.
 Copyright 2020, Dow Jones & Company, Inc. All Rights Reserved Worldwide. LEARN MORE


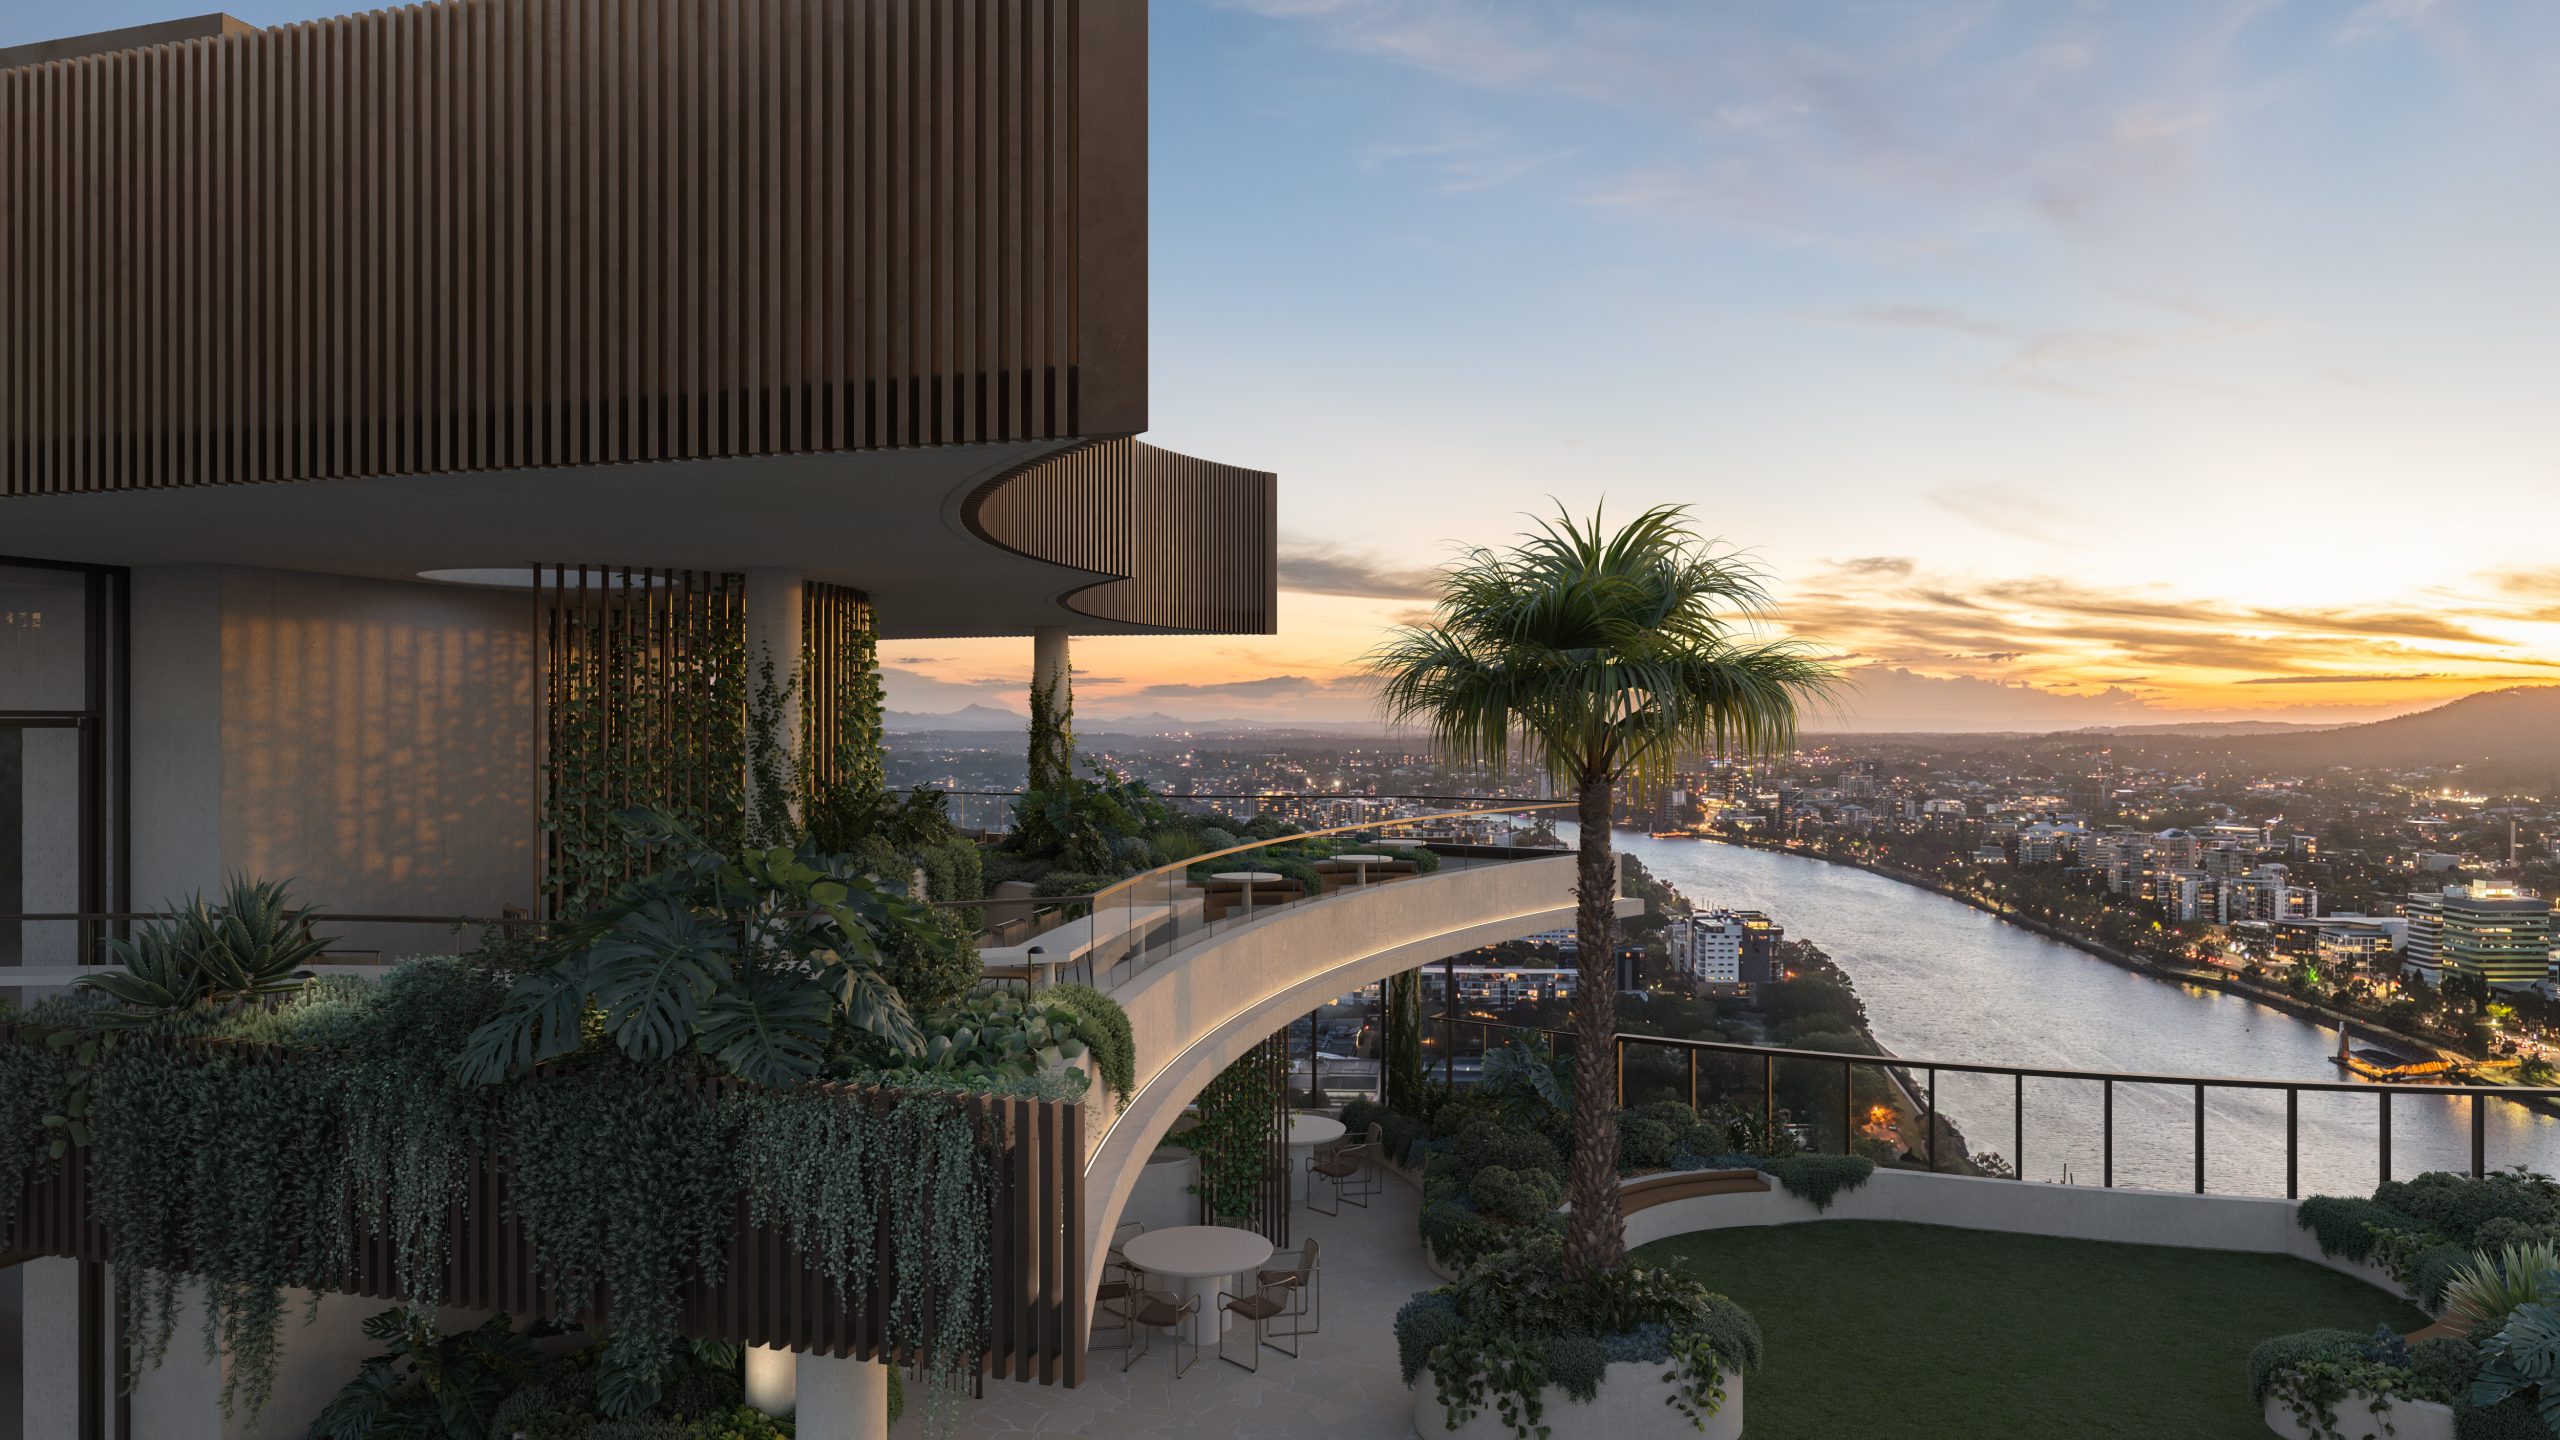
Set on one of the city’s last absolute riverfront sites, The Riversdale by Mosaic combines irreplaceable waterfront ownership with one of Brisbane’s most significant residential opportunities.
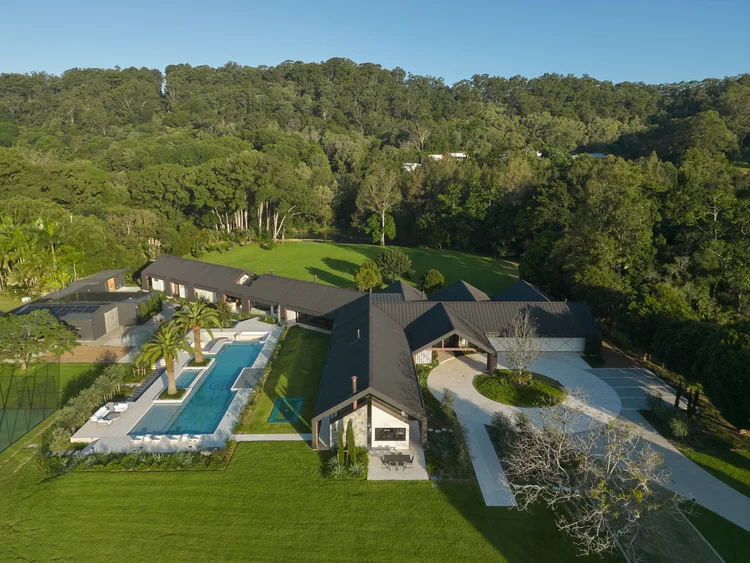
Margot Robbie may have travelled from a Queensland farm to the highest reaches of Hollywood, but a reported $28 million property deal suggests the Gold Coast has never lost its hold on her. The Australian actor and producer is believed to be the mystery buyer of Redwood, a seven-acre Currumbin Valley estate transformed into the …
Continue reading “Margot Robbie Reportedly Behind $28 Million Currumbin Valley Homecoming”
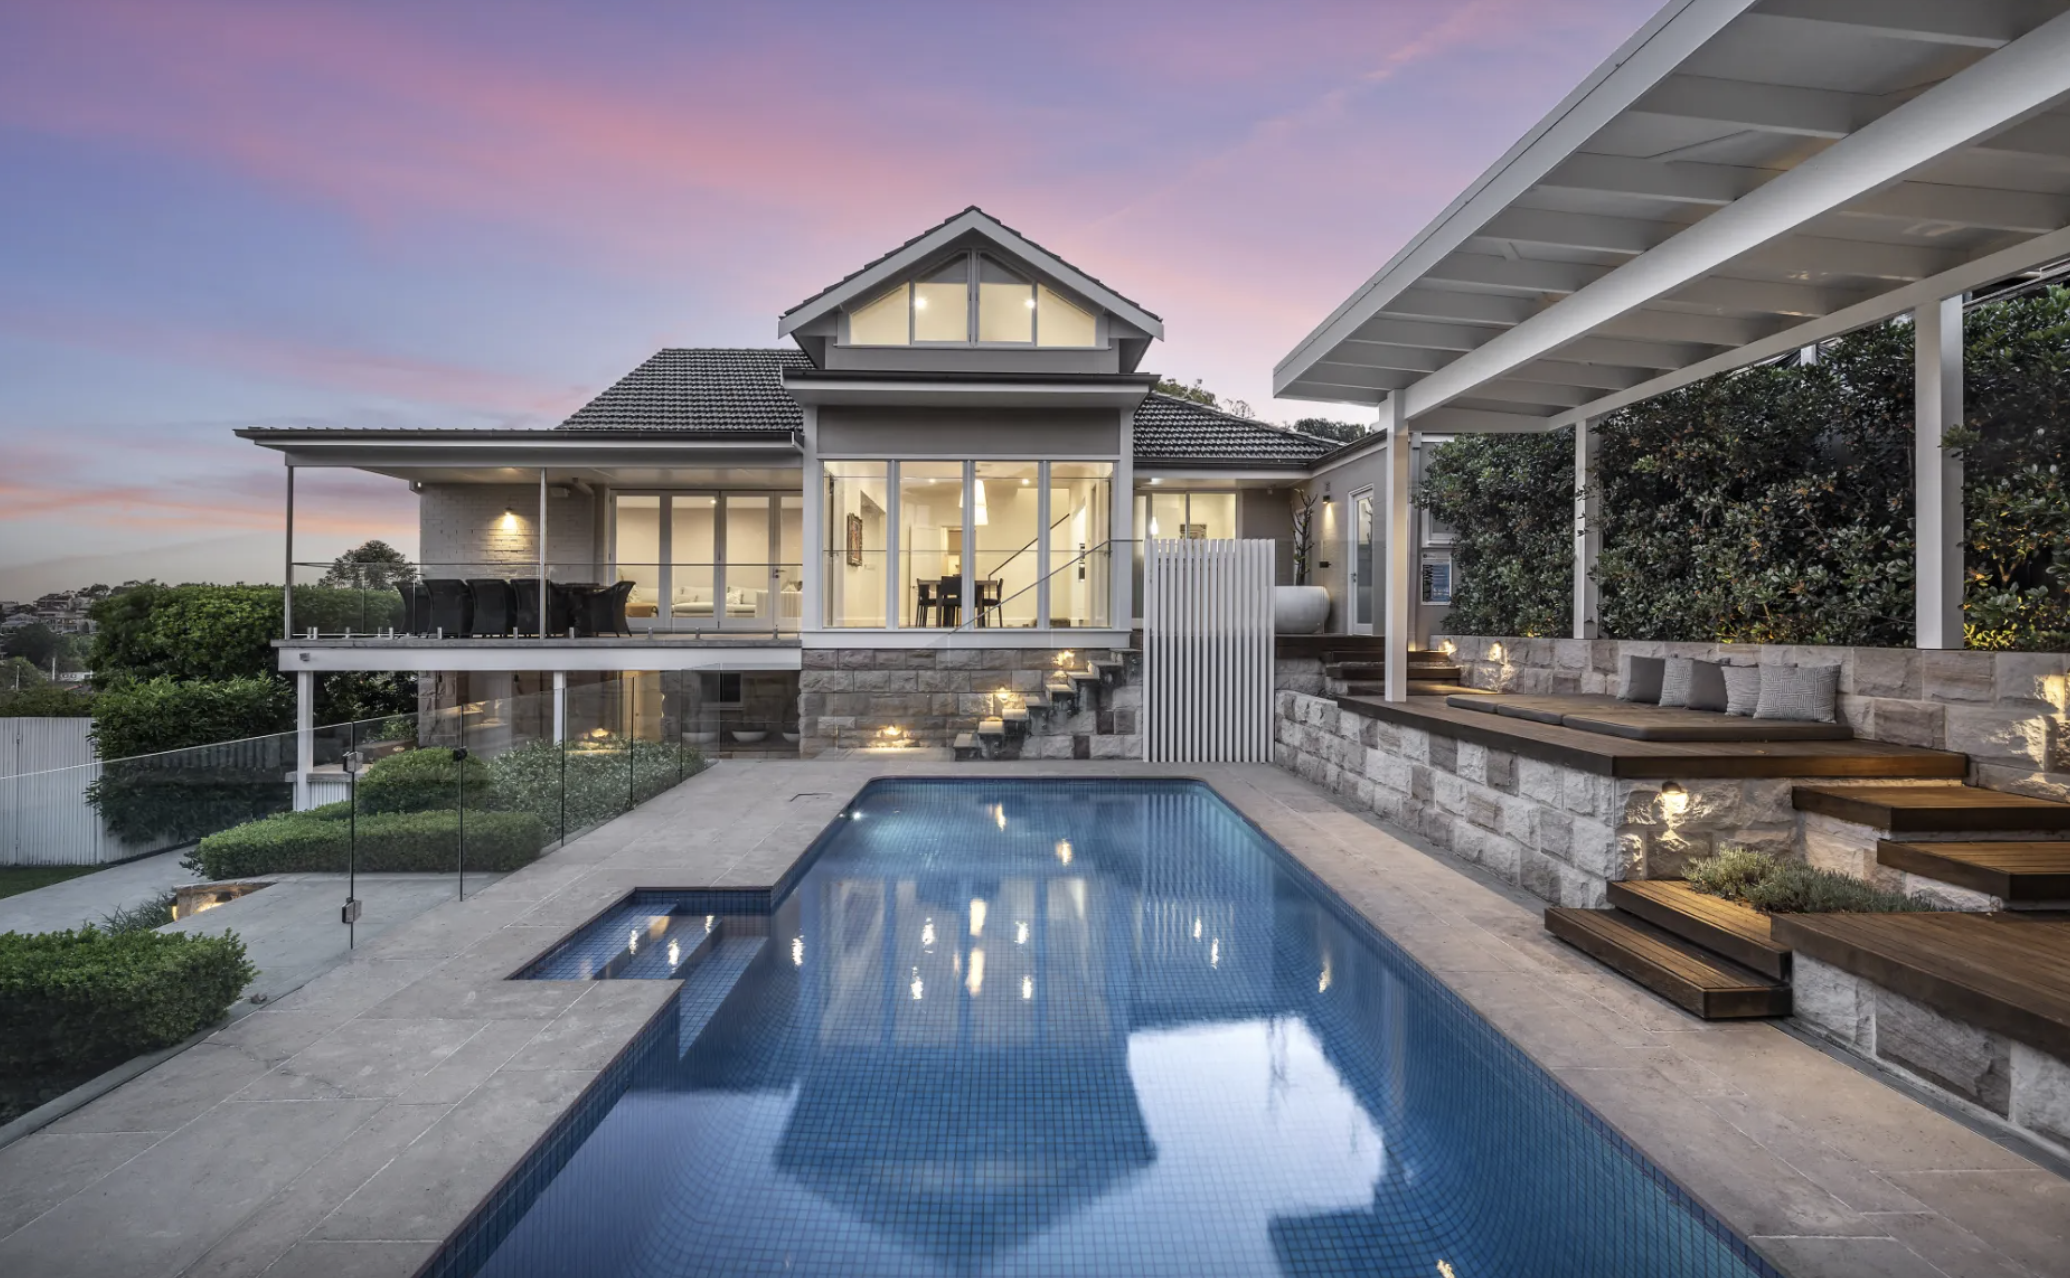
The federal budget has rattled property investors. But the biggest mistake isn’t the tax changes, it’s the conclusion many are drawing from them.
2 min
The recent budget has forced a reckoning for property investors.
Negative gearing now restricted to new residential builds, the CGT discount gone and on paper, the numbers look different.
And many investors are responding by pivoting toward yield, prioritising cash flow over capital growth in a way that property strategists say misses the point entirely.
“The debate has shifted to yield versus growth as if they are opposing forces,” says Abdullah Nouh, founder of Melbourne-based buyers’ agency Mecca Property Group. “But that framing is itself the mistake.”
Nouh, who works with high-net-worth families and investors on long-term acquisition strategy, argues that capital growth remains the primary driver of genuine wealth creation and that the post-budget environment has made quality assets more important, not less.
The numbers make his case plainly. An additional $500 per week in rental income is welcome. A prestige asset appreciating by $1 million over a market cycle is transformative.
These are not equivalent outcomes, and portfolios built around yield at the expense of location and land value tend to generate income while wealth stands largely still.
The more nuanced shift Nouh is seeing among sophisticated investors is a move toward assets where both outcomes can be engineered simultaneously – established homes on substantial land in quality locations, where the existing dwelling can be repositioned, rental returns improved, and the underlying land value compounds independent of what sits on it.
For investors with existing equity, commercial property is also entering the conversation in a more serious way.
Prestige industrial assets, medical centres and long-leased essential retail offer income profiles that residential property in most capital city markets cannot currently match: longer lease terms, tenants covering outgoings, and greater predictability than the residential tenancy cycle.
“The investors who build lasting wealth are rarely the ones who chased yield or growth exclusively,” says Nouh.
“They are the ones who built a strategy they could sustain – one that generated enough income to hold quality assets through multiple cycles while those assets compounded in value.”
The budget has changed the settings. It has not changed the fundamentals.

Australia’s housing market defies forecasts as prices surge past pandemic-era benchmarks.
Set on one of the city’s last absolute riverfront sites, The Riversdale by Mosaic combines irreplaceable waterfront ownership with one of Brisbane’s most significant residential opportunities.