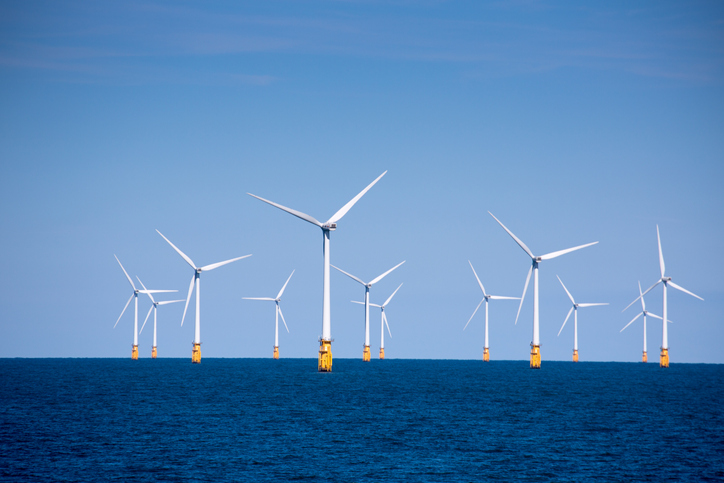
The Bill for Offshore Wind Power Is Rising
Prices in recent offshore auctions have increased by anywhere from 20% to 70%
With offshore wind projects bleeding cash, governments will have to pay more to hit their clean-energy targets. Recent auctions show just how much more.
Higher prices for steel, labor and debt financing have raised the cost of developing a wind farm by almost 40% since 2019. It is a big problem for developers like Danish energy company Ørsted, which signed power supply agreements a few years ago at prices that no longer cover today’s costs.
Developers’ struggles are having a knock-on effect on the turbine makers that supply them, including Vestas, GE and Siemens Energy. The latter’s wind unit, Siemens Gamesa, lost €4.3 billion in the company’s latest fiscal year, equivalent to $4.7 billion at current exchange rates—although its issues are mainly with faulty onshore turbines rather than offshore ones.
Germany last week stepped in with a multi-billion-euro state-backed guarantee for Siemens Energy, which told investors at a capital markets day on Tuesday that its wind division won’t make a profit until after 2026. GE says its offshore wind business will lose $1 billion this year, and the same again in 2024.
The industry’s deepest challenges are in the U.S., a market that was meant to be the next growth frontier following the Biden administration’s pledge to install 30 gigawatts of offshore capacity by 2030. Instead, developers are taking multibillion-dollar impairments on U.S. projects, or backing out entirely. According to BloombergNEF, of the 21.6 gigawatts of offshore wind power awarded or signed so far in the U.S., a quarter has been canceled and almost another third is at risk.
Governments are now responding by topping up the prices at which they auction off licenses. Britain was forced to raise its guaranteed price for offshore wind power by 66% after a September auction didn’t attract a single bid. The average price in New York’s latest offshore wind auction in October was a fifth higher than previous rounds, according to BloombergNEF, and the bill could rise further as new contracts include inflation protection that will shield developers from future cost pressures.
Paying higher, more flexible prices for fresh contracts might still end up being a cheaper solution for New York than renegotiating old ones. Developers including BP and Equinor asked for increases of 49% on average over what was agreed in their original power supply contracts. They may pull out after getting a no from the state.
Governments and companies had become used to the cost of renewable energy heading only one way. The global average levelized cost of electricity generated by offshore wind—a measure of the minimum price necessary to cover the lifetime costs of a project—has plunged by 66% since 2009, according to BloombergNEF data.
After years of becoming more competitive as a source of power, offshore wind is beginning to look expensive in some markets compared with fossil-fuel alternatives. Globally, new offshore wind projects still work out cheaper than natural gas ones and are level with coal. But offshore wind looks costly in the U.S., partly because the supply chain is so immature and will need heavy investment for several years.
The new reality makes it harder for governments to meet their net-zero targets while also keeping power costs low for the public. But densely populated areas like New York may not have much choice but to exploit offshore wind. Clean alternatives such as land-based wind and solar farms are tough to roll out where space is at a premium.
The European Union is also aware that if governments don’t do more to support local companies like Siemens Energy, Chinese turbine manufacturers that enjoy generous subsidies from Beijing will be only too happy to step in. This would help the EU stay on track with an ambitious plan to increase its offshore wind capacity sevenfold by 2030, but at the expense of the bloc’s energy independence.
Harnessing the winds out at sea is still a key part of countries’ plans to cut their carbon emissions and boost energy security. But governments can no longer pretend that these political objectives can come cheap.
 Copyright 2020, Dow Jones & Company, Inc. All Rights Reserved Worldwide. LEARN MORE
This stylish family home combines a classic palette and finishes with a flexible floorplan
Just 55 minutes from Sydney, make this your creative getaway located in the majestic Hawkesbury region.
Continued stagflation and cost of living pressures are causing couples to think twice about starting a family, new data has revealed, with long term impacts expected
Australia is in the midst of a ‘baby recession’ with preliminary estimates showing the number of births in 2023 fell by more than four percent to the lowest level since 2006, according to KPMG. The consultancy firm says this reflects the impact of cost-of-living pressures on the feasibility of younger Australians starting a family.
KPMG estimates that 289,100 babies were born in 2023. This compares to 300,684 babies in 2022 and 309,996 in 2021, according to the Australian Bureau of Statistics (ABS). KPMG urban economist Terry Rawnsley said weak economic growth often leads to a reduced number of births. In 2023, ABS data shows gross domestic product (GDP) fell to 1.5 percent. Despite the population growing by 2.5 percent in 2023, GDP on a per capita basis went into negative territory, down one percent over the 12 months.
“Birth rates provide insight into long-term population growth as well as the current confidence of Australian families,” said Mr Rawnsley. “We haven’t seen such a sharp drop in births in Australia since the period of economic stagflation in the 1970s, which coincided with the initial widespread adoption of the contraceptive pill.”
Mr Rawnsley said many Australian couples delayed starting a family while the pandemic played out in 2020. The number of births fell from 305,832 in 2019 to 294,369 in 2020. Then in 2021, strong employment and vast amounts of stimulus money, along with high household savings due to lockdowns, gave couples better financial means to have a baby. This led to a rebound in births.
However, the re-opening of the global economy in 2022 led to soaring inflation. By the start of 2023, the Australian consumer price index (CPI) had risen to its highest level since 1990 at 7.8 percent per annum. By that stage, the Reserve Bank had already commenced an aggressive rate-hiking strategy to fight inflation and had raised the cash rate every month between May and December 2022.
Five more rate hikes during 2023 put further pressure on couples with mortgages and put the brakes on family formation. “This combination of the pandemic and rapid economic changes explains the spike and subsequent sharp decline in birth rates we have observed over the past four years,” Mr Rawnsley said.
The impact of high costs of living on couples’ decision to have a baby is highlighted in births data for the capital cities. KPMG estimates there were 60,860 births in Sydney in 2023, down 8.6 percent from 2019. There were 56,270 births in Melbourne, down 7.3 percent. In Perth, there were 25,020 births, down 6 percent, while in Brisbane there were 30,250 births, down 4.3 percent. Canberra was the only capital city where there was no fall in the number of births in 2023 compared to 2019.
“CPI growth in Canberra has been slightly subdued compared to that in other major cities, and the economic outlook has remained strong,” Mr Rawnsley said. “This means families have not been hurting as much as those in other capital cities, and in turn, we’ve seen a stabilisation of births in the ACT.”
This stylish family home combines a classic palette and finishes with a flexible floorplan
Just 55 minutes from Sydney, make this your creative getaway located in the majestic Hawkesbury region.


