


The Latest Dirty Word in Corporate America: ESG
Executives switch to alternatives like ‘responsible business’ to describe corporate initiatives

 4 min
4 min
Many companies no longer utter these three letters: E-S-G.
Following years of simmering investor backlash, political pressure and legal threats over environmental, social and governance efforts, a number of business leaders are now making a conscious effort to avoid the once widely used acronym for such initiatives.
On earnings calls, many chief executives now employ new approaches. Some companies, including Coca-Cola, are rebranding corporate reports and committees, stripping ESG from titles. Advisers are coaching executives on alternative ways to describe their efforts, proposing new terms like “responsible business.” On Wall Street, meanwhile, some firms are closing once-popular ESG funds as interest fades.
The shift in messaging reflects a reality: “ESG is complicated,” said Daryl Brewster, a former Kraft Foods and Nabisco executive who now heads Chief Executives for Corporate Purpose, a nonprofit of more than 200 companies focused on social impact.
The movement to bake accountability into business decisions stretches back centuries; the term ESG gained momentum after the United Nations used it about 20 years ago. Over time, the effort became divisive—derided by some state officials as “woke capitalism,” and criticised by others for putting too much focus on measurement and disclosure requirements.
Many CEOs stress that they continue to follow sustainability commitments made years ago—even if they are no longer talking about them as often publicly. A December survey by the advisory firm Teneo found that about 8% of CEOs are ramping down their ESG programs; the rest are staying the course but often making changes to how they handle them.
Many leaders are more closely examining disclosures, wanting to avoid regulatory scrutiny or political criticism. In lieu of lofty pronouncements, advisers are telling CEOs to be more precise and to set goals that can be achieved. Saying as little as possible is recommended.
“We’ve seen a great deal of reframing and adjusting by CEOs in the ESG arena. Not only of what they say, but also where they say it and how they characterise it,” said Brad Karp, chair of law firm Paul Weiss who advises a number of CEOs. “Most companies are moving forward operationally with their ESG programs, but not publicly touting them, or describing them in different ways.”
When Thomas Buberl, CEO of Paris-based insurer AXA, met in the U.S. last year with the leaders of an asset manager, a fertiliser maker and a tech company, executives suggested that he reflect the newfound caution. “I used the abbreviation ESG, and people taught me not to use that word,” Buberl said. “I said, ‘What do you want me to call it?’”
Few people had a ready answer. Buberl said the importance of environmental efforts and other goals shouldn’t be underplayed. “We need to move from intentions to actions,” he said.
ESG became even more politicised following a spat in 2022 between Disney and Florida Gov. Ron DeSantis. That opened the door to sharp commentary on ESG efforts broadly by more than a dozen other state officials and a pullback by some asset managers. Investors yanked more than $14 billion from ESG funds in the first nine months of 2023, according to Morningstar.
BlackRock’s Larry Fink wrote a letter to investors in 2023 that didn’t explicitly reference ESG, after some states pulled money in 2022 over the firm’s ESG emphasis. State Street in November announced a new voting policy for investors who may not want to emphasise ESG as heavily. Fidelity last year removed language considering potential ESG impacts from its proxy-review process.
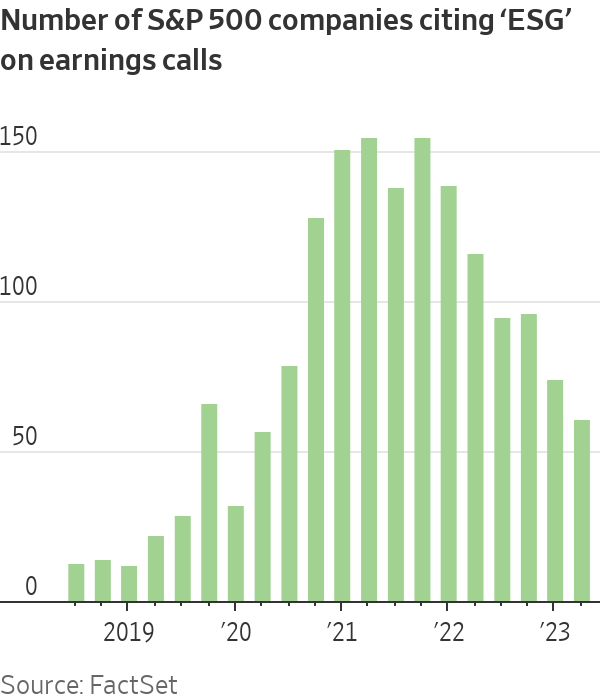
On earnings calls, mentions of ESG rose steadily until 2021 and have declined since, according to a FactSet analysis. In the fourth quarter of 2021, 155 companies in the S&P 500 mentioned ESG initiatives; by the second quarter of 2023, that had fallen to 61 mentions.
Adding to the challenges for companies is that some dimensions of ESG, particularly the social goals, can be difficult to quantify. Corporate diversity programs, often part of an ESG agenda, face new scrutiny following a Supreme Court decision on affirmative action and legal challenges from largely conservative groups.
Executives and their advisers say companies remain more committed to the “E” in ESG, wanting to respond to climate change. Some CEOs say that environmental factors are crucial to their business, one reason many went to Dubai for COP28, the U.N.’s climate conference. Climate change is also likely to be a key theme at the World Economic Forum in Davos, Switzerland, next week.
Revathi Advaithi, CEO of Flex, said the manufacturer has 130 factories across the world and there isn’t a question of whether they need to operate in a sustainable way.
“It’s not as though I got a whole bunch of new investors because we had a sustainability report or we were ESG-focused,” she said. “We didn’t do it for that purpose…. We wanted to focus on water reduction, power reduction, all those things. So I don’t view it as, hey, it’s a trend that came today and it’s gonna go off tomorrow.”
Some of the changes leaders are making are subtle. At Coca-Cola, the company published a “Business & ESG” report in 2022; in 2023, it was released as the “Business and Sustainability” report. The beverage giant also renamed committees on its board of directors.
The fiercest critics of ESG say they welcome less discussion of it. “If this trend is decreasing, these CEOs must have realised that this puts them at greater legal risk and costs them customers,” said Texas Attorney General Ken Paxton, who has pushed back against ESG policies, in a statement.
What to call such efforts now remains a debate. Brewster’s nonprofit CEO group advises leaders to discuss initiatives in clear language, explaining efforts to cut water use, for example, or to use terms such as “our people” or “our natural resources.” Brewster said he wants more leaders to adopt the phrase “responsible business.”
“You can be anti-ESG,” Brewster said. “It’s hard to be anti-responsibility.”
 Copyright 2020, Dow Jones & Company, Inc. All Rights Reserved Worldwide. LEARN MORE


From snow-dusted valleys to festival-filled autumns, Bhutan reveals itself as a rare destination where culture, nature and spirituality unfold year-round.

Odd Culture Group brings a new kind of after-dark energy to the CBD, where daiquiris, disco and design collide beneath the city streets.


The lunar flyby would be the deepest humans have traveled in space in decades.
4 min
It’s go time for the highest-stakes mission at NASA in more than 50 years.
On April 1, the agency is set to launch four astronauts around the moon, the deepest human spaceflight since the final Apollo lunar landing in 1972.
The launch window for Artemis II , as the mission is called, opens at 6:24 p.m. ET.
National Aeronautics and Space Administration teams have been preparing the vehicles to depart from Florida’s Kennedy Space Center on the planned roughly 10-day trip. Crew members have trained for years for this moment.
Reid Wiseman, the NASA astronaut serving as mission commander, said he doesn’t fear taking the voyage. A widower, he does worry at times about what he is putting his daughters through.
“I could have a very comfortable life for them,” Wiseman said in an interview last September.
“But I’m also a human, and I see the spirit in their eyes that is burning in my soul too. And so we’ve just got to never stop going.”
Wiseman’s crewmates on Artemis II are NASA’s Victor Glover and Christina Koch, as well as Canadian Space Agency astronaut Jeremy Hansen.

What are the goals for Artemis II?
The biggest one: Safely fly the crew on vehicles that have never carried astronauts before.
The towering Space Launch System rocket has the job of lofting a vehicle called Orion into space and on its way to the moon.
Orion is designed to carry the crew around the moon and back. Myriad systems on the ship—life support, communications, navigation—will be tested with the astronauts on board.
SLS and Orion don’t have much flight experience. The vehicles last flew in 2022, when the agency completed its uncrewed Artemis I mission .
How is the mission expected to unfold?
Artemis II will begin when SLS takes off from a launchpad in Florida with Orion stacked on top of it.
The so-called upper stage of SLS will later separate from the main part of the rocket with Orion attached, and use its engine to set up the latter vehicle for a push to the moon.
After Orion separates from the upper stage, it will conduct what is called a translunar injection—the engine firing that commits Orion to soaring out to the moon. It will fly to the moon over the course of a few days and travel around its far side.
Orion will face a tough return home after speeding through space. As it hits Earth’s atmosphere, Orion will be flying at 25,000 miles an hour and face temperatures of 5,000 degrees as it slows down. The capsule is designed to land under parachutes in the Pacific Ocean, not far from San Diego.

Is it possible Artemis II will be delayed?
Yes.
For safety reasons, the agency won’t launch if certain tough weather conditions roll through the Cape Canaveral, Fla., area. Delays caused by technical problems are possible, too. NASA has other dates identified for the mission if it doesn’t begin April 1.
Who are the astronauts flying on Artemis II?
The crew will be led by Wiseman, a retired Navy pilot who completed military deployments before joining NASA’s astronaut corps. He traveled to the International Space Station in 2014.
Two other astronauts will represent NASA during the mission: Glover, an experienced Navy pilot, and Koch, who began her career as an electrical engineer for the agency and once spent a year at a research station in the South Pole. Both have traveled to the space station before.
Hansen is a military pilot who joined Canada’s astronaut corps in 2009. He will be making his first trip to space.
Koch’s participation in Artemis II will mark the first time a woman has flown beyond orbits near Earth. Glover and Hansen will be the first African-American and non-American astronauts, respectively, to do the same.
What will the astronauts do during the flight?
The astronauts will evaluate how Orion flies, practice emergency procedures and capture images of the far side of the moon for scientific and exploration purposes (they may become the first humans to see parts of the far side of the lunar surface). Health-tracking projects of the astronauts are designed to inform future missions.
Those efforts will play out in Orion’s crew module, which has about two minivans worth of living area.
On board, the astronauts will spend about 30 minutes a day exercising, using a device that allows them to do dead lifts, rowing and more. Sleep will come in eight-hour stretches in hammocks.
There is a custom-made warmer for meals, with beef brisket and veggie quiche on the menu.
Each astronaut is permitted two flavored beverages a day, including coffee. The crew will hold one hourlong shared meal each day.
The Universal Waste Management System—that’s the toilet—uses air flow to pull fluid and solid waste away into containers.
What happens after Artemis II?
Assuming it goes well, NASA will march on to Artemis III, scheduled for next year. During that operation, NASA plans to launch Orion with crew members on board and have the ship practice docking with lunar-lander vehicles that Elon Musk’s SpaceX and Jeff Bezos’ Blue Origin have been developing. The rendezvous operations will occur relatively close to Earth.
NASA hopes that its contractors and the agency itself are ready to attempt one or more lunar landing missions in 2028. Many current and former spaceflight officials are skeptical that timeline is feasible.

From Italian vegetable-tanned leather to real-world training insight, Australian brand PK9 Gear is redefining what luxury means for discerning dog owners.

The megamansion was built for Tony Pritzker, heir to the Hyatt Hotel fortune and brother of Illinois Gov. JB Pritzker.

