The Primary Breadwinner Is Disappearing From More Homes
The economics of marriage are changing, but women still take on more of the unpaid labour
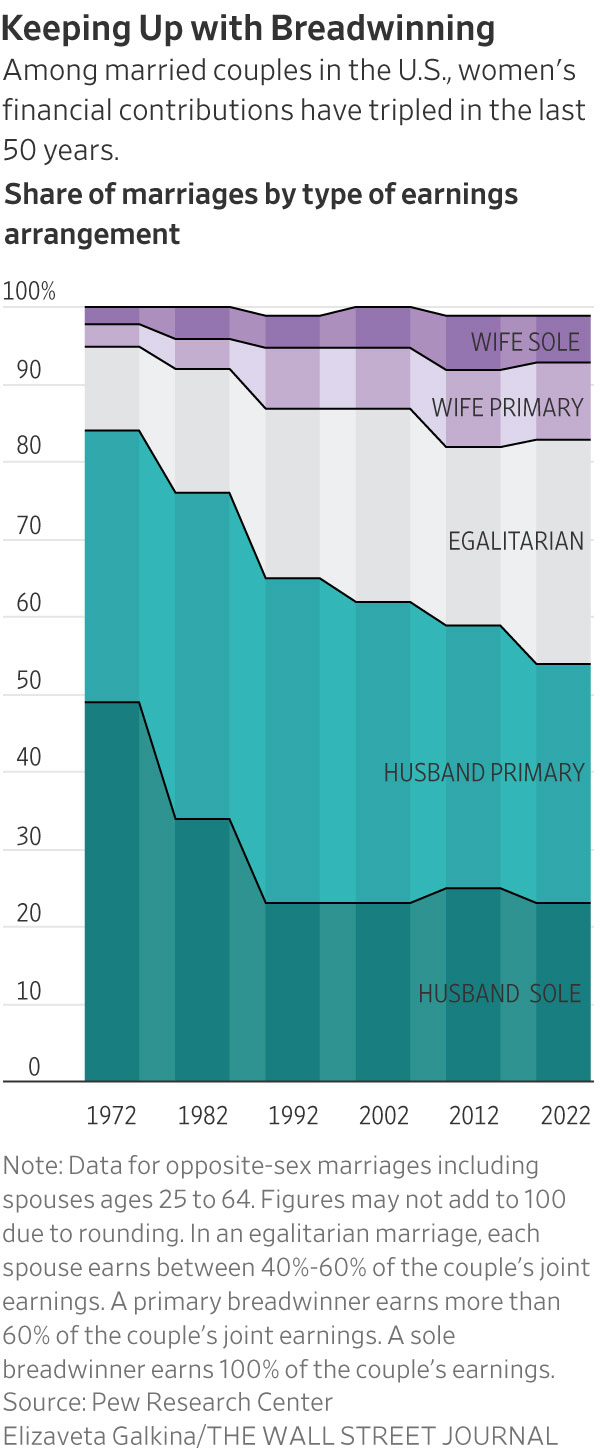
Nearly a third of marriages today have no primary breadwinner, as women continue to make strides toward greater equality at work and home.
About 30% of U.S. opposite-sex marriages are egalitarian in earnings, according to new data from Pew Research Center, meaning each spouse earns somewhere between 40% and 60% of the couples’ joint earnings. One of the main drivers of the shift is younger women making more money, said Pew.
The share of women earning more than their husbands has more than tripled from 5% to 16% over the last 50 years. In 1972, 49% of husbands were the sole breadwinner, meaning the husband had positive earnings and the wife had no earnings. By 2022, that share had dropped to 23% of opposite-sex marriages.
But the larger financial contributions by women don’t mean that relationships are more equal or women are better off in every realm of life, said Richard Fry, senior researcher at Pew Research Center.

Even when women earn as much as their husbands, they still put in around two more hours a week on caregiving than their husbands do, plus another 2.5 hours more on housework, according to Pew. In those same relationships, men spend nearly 3.5 more hours on leisure activities, such as watching television or playing video games, than their wives do.
Women’s economic role in marriages continues to rise despite a persistent gender pay gap and declining labor-force participation, Mr. Fry said. “In spite of some trends that would suggest to me that women’s economic role would not be growing, what we found was ‘No, it still is,’” he said.
Financial advisers and researchers say the changing money dynamic can cause marital strife, or in some cases, divorce.
Changes in breadwinner status “can lead to a lot of frustrations and arguments and resentment,” said Stacy Francis, president and chief executive of wealth-management firm Francis Financial and founder of a financial-education nonprofit.
When Ms. Francis, who often works with breadwinning women, surpassed her husband in earnings, she said the pair celebrated. After years of bearing the burden of bringing home most of the bacon, her husband was somewhat relieved to turn the job over to her, she said.
But Ms. Francis, now 48, soon found herself spending more time in the kitchen, throwing herself into the local parent-teacher association and planning her son’s prom—all, she said, in an effort to somehow compensate for other work and time spent away.
“It made me feel less feminine to earn more than my husband,” she said. “I realised, looking back, that I myself had to get comfortable with that role.”
Men remain the breadwinner in most marriages, meaning they earn more than 60% of the total earnings, Pew found.
The marriages with the highest total income are those in which both spouses are bringing in money. Marriages in which women are the primary breadwinners earn more than those in which men hold the same role: $145,000 in median income compared with $121,000 for marriages overall, according to the Pew data. A primary breadwinner in Pew’s research occurs when one spouse earns more than 60% of the household earnings.
Sole-breadwinner couples, or marriages in which one spouse has earnings and the other has none, make significantly less, with median incomes of around $75,000. Such couples also are more likely to be below the poverty line.
When women are the sole breadwinners, men spend more time on caregiving and a more equal amount of housework, compared with egalitarian marriages. But women still spend roughly the same amount of time on caregiving and household work, regardless of whether they are in egalitarian marriages or are sole or primary breadwinners, Pew found. Women without children are more likely to be the primary breadwinner than those with children.
Spouses within same-sex couples, however, tend to split the domestic labor more equally than their heterosexual counterparts, research shows.
Some researchers say one reason for the housework divide is that most of these gender roles have been built up over generations. There is a fear from some women that stopping this work could risk their marriage.
“We still see that there are remnants and large cultural issues associated with the sensitivity of women’s economic success, as a thing that destroys relationships,” said Johanna Rickne, professor of economics at the Swedish Institute for Social Research at Stockholm University.
Both husbands and wives can work to address these imbalances, said Jennifer Clark, a 34-year-old digital marketer based outside Chicago.
While her husband, a director of an audio-production company, has earned more than Ms. Clark for much of their 10-year marriage, she sets the monthly budget and manages household finances.
“It doesn’t feel like he has a larger share of the finances even though he is earning that money,” she said.
Throughout their marriage, Ms. Clark worked in freelance and part-time roles while her husband had full-time jobs. During those periods, she said, she bore a greater share of the household and caregiving responsibilities for their two children. But talking about their finances and making decisions together helped them remain equal partners.
“I would say I’ve always had a pretty good sense of financial autonomy, even with money I didn’t necessarily earn, because we make those decisions collaboratively,” she said.
 Copyright 2020, Dow Jones & Company, Inc. All Rights Reserved Worldwide. LEARN MORE
This stylish family home combines a classic palette and finishes with a flexible floorplan
Just 55 minutes from Sydney, make this your creative getaway located in the majestic Hawkesbury region.
Continued stagflation and cost of living pressures are causing couples to think twice about starting a family, new data has revealed, with long term impacts expected
Australia is in the midst of a ‘baby recession’ with preliminary estimates showing the number of births in 2023 fell by more than four percent to the lowest level since 2006, according to KPMG. The consultancy firm says this reflects the impact of cost-of-living pressures on the feasibility of younger Australians starting a family.
KPMG estimates that 289,100 babies were born in 2023. This compares to 300,684 babies in 2022 and 309,996 in 2021, according to the Australian Bureau of Statistics (ABS). KPMG urban economist Terry Rawnsley said weak economic growth often leads to a reduced number of births. In 2023, ABS data shows gross domestic product (GDP) fell to 1.5 percent. Despite the population growing by 2.5 percent in 2023, GDP on a per capita basis went into negative territory, down one percent over the 12 months.
“Birth rates provide insight into long-term population growth as well as the current confidence of Australian families,” said Mr Rawnsley. “We haven’t seen such a sharp drop in births in Australia since the period of economic stagflation in the 1970s, which coincided with the initial widespread adoption of the contraceptive pill.”
Mr Rawnsley said many Australian couples delayed starting a family while the pandemic played out in 2020. The number of births fell from 305,832 in 2019 to 294,369 in 2020. Then in 2021, strong employment and vast amounts of stimulus money, along with high household savings due to lockdowns, gave couples better financial means to have a baby. This led to a rebound in births.
However, the re-opening of the global economy in 2022 led to soaring inflation. By the start of 2023, the Australian consumer price index (CPI) had risen to its highest level since 1990 at 7.8 percent per annum. By that stage, the Reserve Bank had already commenced an aggressive rate-hiking strategy to fight inflation and had raised the cash rate every month between May and December 2022.
Five more rate hikes during 2023 put further pressure on couples with mortgages and put the brakes on family formation. “This combination of the pandemic and rapid economic changes explains the spike and subsequent sharp decline in birth rates we have observed over the past four years,” Mr Rawnsley said.
The impact of high costs of living on couples’ decision to have a baby is highlighted in births data for the capital cities. KPMG estimates there were 60,860 births in Sydney in 2023, down 8.6 percent from 2019. There were 56,270 births in Melbourne, down 7.3 percent. In Perth, there were 25,020 births, down 6 percent, while in Brisbane there were 30,250 births, down 4.3 percent. Canberra was the only capital city where there was no fall in the number of births in 2023 compared to 2019.
“CPI growth in Canberra has been slightly subdued compared to that in other major cities, and the economic outlook has remained strong,” Mr Rawnsley said. “This means families have not been hurting as much as those in other capital cities, and in turn, we’ve seen a stabilisation of births in the ACT.”
This stylish family home combines a classic palette and finishes with a flexible floorplan
Just 55 minutes from Sydney, make this your creative getaway located in the majestic Hawkesbury region.


