The World Has 192 People Worth More Than US$10 Billion, Wealth-X Says
Around 17% of the total billionaires’ wealth was held by 20 “super-billionaires”.
Despite the Covid-19 pandemic, the global billionaire population continued to expand in 2021 for the third year in a row.
There were 3,311 billionaires by the end of last year, up 3.3% from 2020’s 3,204. Their combined wealth surged 17.8% to a record US$11.8 trillion, according to a report released Wednesday by Wealth-X, a global wealth information and insight provider.
Out of the billionaire population, more than half were considered to be “lower end,” which includes those with a wealth between US$1 billion and US$2 billion. About 192 individuals, or 6% of the global billionaire population, each had a net worth in excess of US$10 billion. But this group’s combined wealth, at US$4.8 trillion, accounted for 41% of the total billionaires’ wealth and was just shy of the annual market value of the Japanese economy, the third largest in the world, according to the report.
Around 17% of the total billionaires’ wealth was held by 20 “super-billionaires,” or individuals with a net worth of more than US$50 billion. This exclusive list includes SpaceX’s Elon Musk with an estimated net worth of US$234.5 billion; LVMH’s Bernard Arnault, whose family has more than US$151 billion; and Amazon’s Jeff Bezos, with a net worth of US$142.2 billion.
This trend—wealth increasingly concentrated in the top-tier even of the world’s richest class—has many contributing factors, including the rapid digitalization of the global economy, central bank stimuli, the rise of “big tech,” and real estate growth, according to the report.
“Since 2020, the disruptive impact of the pandemic on the global economy has reinforced many of these trends,” the report said.
Regionally, North America still dominated with 1,035 billionaires, exceeding the 1,000 threshold for the first time. That was a 5.6% increase from 2020.
Europe registered the strongest growth, with its billionaire population rising 6.8% year over year to 954. Asia, not including the Pacific, accounted for 899 billionaires, up 1.8% from a year ago.
At the country level, the U.S. topped the list with 975 billionaires and a combined billionaire wealth of US$4.45 trillion. China (excluding the Hong Kong Special Region) came second with 400 billionaires, down 2.4% from 2020.
Germany, India, and the U.K. completed the top five countries with the largest billionaire populations.
Of note was India, which, with 124 billionaires, jumped four places from a year ago and replaced Russia as the fourth-ranked billionaire country. Russia’s billionaire population shrank 10.8% in 2021 to 107 individuals, landing to the eighth place on the list, according to the report.
India’s billionaire wealth creation “is being supported by a combination of robust economic growth, structural reform, infrastructure development and political patronage,” the report said.
Other key findings in the report include:
- New York was the top city for billionaires with 135, followed by Hong Kong (114) and San Francisco (85);
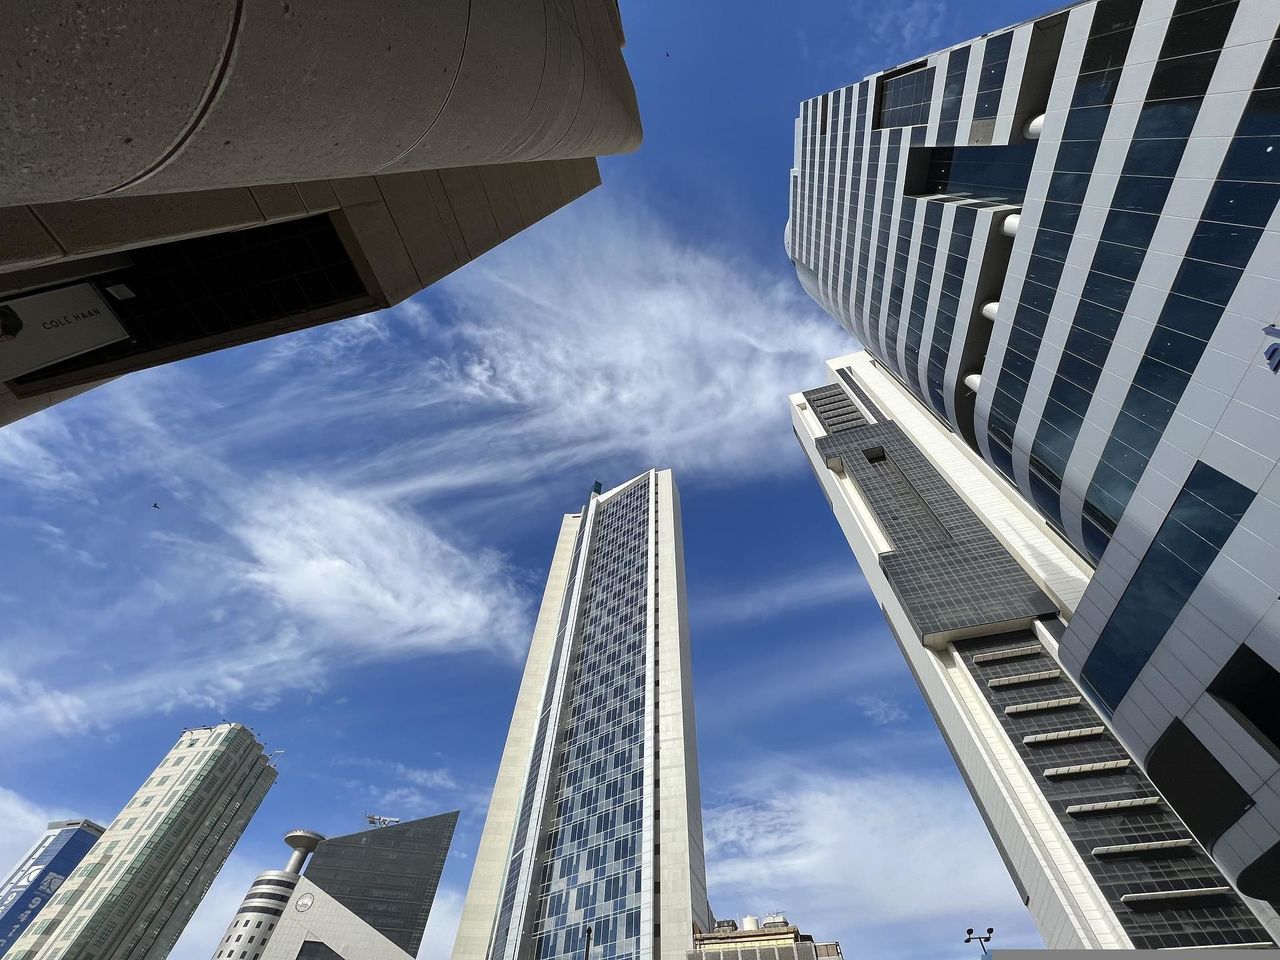
- Kuwait City, the capital of Kuwait on the Persian Gulf, was the top-ranked city for billionaire density, with one billionaire for approximately every 33,000 residents; San Francisco and Hong Kong came second and third, respectively;
- The banking and finance sector was the dominant primary industry, accounting for more than one-fifth of the global billionaire population. It was followed by industrial conglomerates, real estate, tech, and manufacturing;
- The top philanthropic cause among the billionaire class was education, with 65.9% of billionaires giving to this cause. Other top causes included healthcare and medical research (42.7%); art and culture (41.2%); social services (38%); and environmental and animal protection (19.1%);
- 40% of billionaires were aged 70 and over; 11% were younger than 50, with a median age of 66; Tech billionaires had a median age of 55;
- About 13% of billionaires were female.
 Copyright 2020, Dow Jones & Company, Inc. All Rights Reserved Worldwide. LEARN MORE
This stylish family home combines a classic palette and finishes with a flexible floorplan
Just 55 minutes from Sydney, make this your creative getaway located in the majestic Hawkesbury region.
Continued stagflation and cost of living pressures are causing couples to think twice about starting a family, new data has revealed, with long term impacts expected
Australia is in the midst of a ‘baby recession’ with preliminary estimates showing the number of births in 2023 fell by more than four percent to the lowest level since 2006, according to KPMG. The consultancy firm says this reflects the impact of cost-of-living pressures on the feasibility of younger Australians starting a family.
KPMG estimates that 289,100 babies were born in 2023. This compares to 300,684 babies in 2022 and 309,996 in 2021, according to the Australian Bureau of Statistics (ABS). KPMG urban economist Terry Rawnsley said weak economic growth often leads to a reduced number of births. In 2023, ABS data shows gross domestic product (GDP) fell to 1.5 percent. Despite the population growing by 2.5 percent in 2023, GDP on a per capita basis went into negative territory, down one percent over the 12 months.
“Birth rates provide insight into long-term population growth as well as the current confidence of Australian families,” said Mr Rawnsley. “We haven’t seen such a sharp drop in births in Australia since the period of economic stagflation in the 1970s, which coincided with the initial widespread adoption of the contraceptive pill.”
Mr Rawnsley said many Australian couples delayed starting a family while the pandemic played out in 2020. The number of births fell from 305,832 in 2019 to 294,369 in 2020. Then in 2021, strong employment and vast amounts of stimulus money, along with high household savings due to lockdowns, gave couples better financial means to have a baby. This led to a rebound in births.
However, the re-opening of the global economy in 2022 led to soaring inflation. By the start of 2023, the Australian consumer price index (CPI) had risen to its highest level since 1990 at 7.8 percent per annum. By that stage, the Reserve Bank had already commenced an aggressive rate-hiking strategy to fight inflation and had raised the cash rate every month between May and December 2022.
Five more rate hikes during 2023 put further pressure on couples with mortgages and put the brakes on family formation. “This combination of the pandemic and rapid economic changes explains the spike and subsequent sharp decline in birth rates we have observed over the past four years,” Mr Rawnsley said.
The impact of high costs of living on couples’ decision to have a baby is highlighted in births data for the capital cities. KPMG estimates there were 60,860 births in Sydney in 2023, down 8.6 percent from 2019. There were 56,270 births in Melbourne, down 7.3 percent. In Perth, there were 25,020 births, down 6 percent, while in Brisbane there were 30,250 births, down 4.3 percent. Canberra was the only capital city where there was no fall in the number of births in 2023 compared to 2019.
“CPI growth in Canberra has been slightly subdued compared to that in other major cities, and the economic outlook has remained strong,” Mr Rawnsley said. “This means families have not been hurting as much as those in other capital cities, and in turn, we’ve seen a stabilisation of births in the ACT.”
This stylish family home combines a classic palette and finishes with a flexible floorplan
Just 55 minutes from Sydney, make this your creative getaway located in the majestic Hawkesbury region.


