The World Has 124 Self-Made Female Billionaires
Approximately two-thirds are from China, according to a report.

 2 min
2 min
The world has 124 self-made female billionaires, approximately two-thirds from China, according to a report released last Tuesday.
The total number of self-made female billionaires was down from 130 recorded a year ago, and their combined wealth decreased 23% year over year to US$370 billion, according to the report.
China has the largest share of self-made female billionaires, accounting for two thirds of the total, with 78. The U.S. and U.K. came second and third, with 25 and 5, respectively.
“Japan, Germany, France, Canada, and S. Korea are the world’s largest economies without a single self-made woman billionaire,” Rupert Hoogewerf, Hurun’s chairman and chief researcher, said in the report. “The 124 known self-made women billionaires come from just 16 countries, meaning that 180-plus countries still do not have a single one.”
The top three self-made female billionaires are all Chinese, including property developer Wu Yajun, with US$17 billion; apparel fibre producer Fan Hongwei, with US$13 billion; and phone accessory assembler Wang Lichun, with US$11 billion.
Hurun’s rankings are based on market data as of Jan. 14.
Only one out of six of the world’s 556 female billionaires made their fortunes on their own and not through inheritance; 80% of self-made women billionaires made their money from listed companies, according to the report.
Healthcare and software services, with 13 each, were the primary industries of the female billionaires. Consumer goods, retail, and energy were the other top sources of their wealth, according to the report.
The youngest self-made female billionaire was Whitney Wolfe Herd, 32. The founder of the dating app Bumble made the list with an estimated net worth of US$1 billion.
Reality TV personality KimKardashian, 41, was estimated to be worth US$2 billion on the back of her beauty brand KKW Beauty. Barbadian singer Rihanna, 34, of Fenty Beauty, joined the list for the first time with US$1 billion.
Reprinted by permission of Penta. Copyright 2021 Dow Jones & Company. Inc. All Rights Reserved Worldwide. Original date of publication: March 30, 2022
 Copyright 2020, Dow Jones & Company, Inc. All Rights Reserved Worldwide. LEARN MORE


This stylish family home combines a classic palette and finishes with a flexible floorplan

Just 55 minutes from Sydney, make this your creative getaway located in the majestic Hawkesbury region.


Continued stagflation and cost of living pressures are causing couples to think twice about starting a family, new data has revealed, with long term impacts expected
2 min
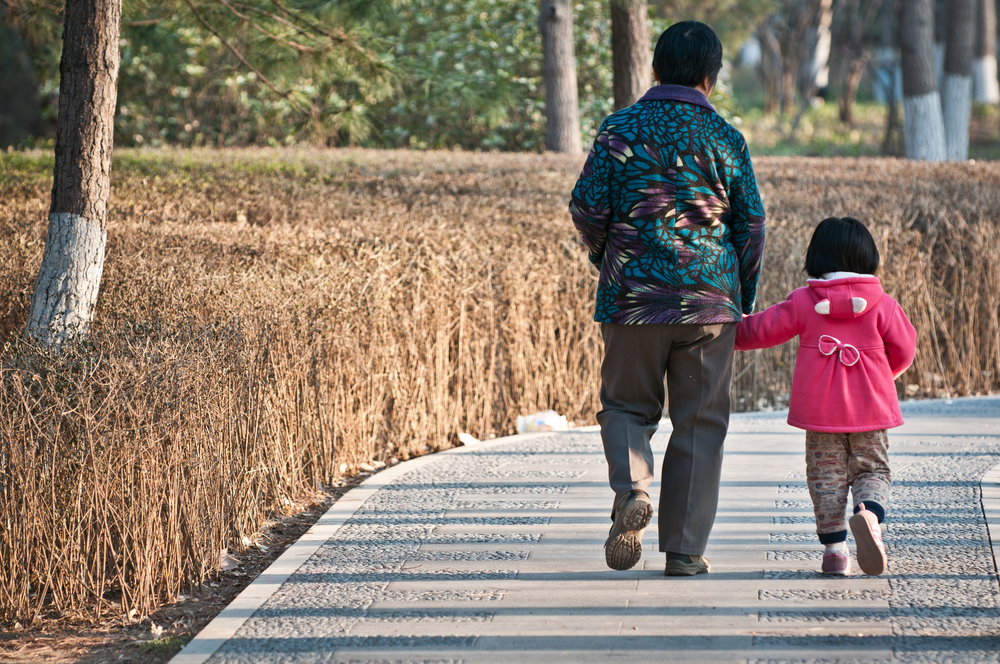
Australia is in the midst of a ‘baby recession’ with preliminary estimates showing the number of births in 2023 fell by more than four percent to the lowest level since 2006, according to KPMG. The consultancy firm says this reflects the impact of cost-of-living pressures on the feasibility of younger Australians starting a family.
KPMG estimates that 289,100 babies were born in 2023. This compares to 300,684 babies in 2022 and 309,996 in 2021, according to the Australian Bureau of Statistics (ABS). KPMG urban economist Terry Rawnsley said weak economic growth often leads to a reduced number of births. In 2023, ABS data shows gross domestic product (GDP) fell to 1.5 percent. Despite the population growing by 2.5 percent in 2023, GDP on a per capita basis went into negative territory, down one percent over the 12 months.
“Birth rates provide insight into long-term population growth as well as the current confidence of Australian families,” said Mr Rawnsley. “We haven’t seen such a sharp drop in births in Australia since the period of economic stagflation in the 1970s, which coincided with the initial widespread adoption of the contraceptive pill.”
Mr Rawnsley said many Australian couples delayed starting a family while the pandemic played out in 2020. The number of births fell from 305,832 in 2019 to 294,369 in 2020. Then in 2021, strong employment and vast amounts of stimulus money, along with high household savings due to lockdowns, gave couples better financial means to have a baby. This led to a rebound in births.
However, the re-opening of the global economy in 2022 led to soaring inflation. By the start of 2023, the Australian consumer price index (CPI) had risen to its highest level since 1990 at 7.8 percent per annum. By that stage, the Reserve Bank had already commenced an aggressive rate-hiking strategy to fight inflation and had raised the cash rate every month between May and December 2022.
Five more rate hikes during 2023 put further pressure on couples with mortgages and put the brakes on family formation. “This combination of the pandemic and rapid economic changes explains the spike and subsequent sharp decline in birth rates we have observed over the past four years,” Mr Rawnsley said.
The impact of high costs of living on couples’ decision to have a baby is highlighted in births data for the capital cities. KPMG estimates there were 60,860 births in Sydney in 2023, down 8.6 percent from 2019. There were 56,270 births in Melbourne, down 7.3 percent. In Perth, there were 25,020 births, down 6 percent, while in Brisbane there were 30,250 births, down 4.3 percent. Canberra was the only capital city where there was no fall in the number of births in 2023 compared to 2019.
“CPI growth in Canberra has been slightly subdued compared to that in other major cities, and the economic outlook has remained strong,” Mr Rawnsley said. “This means families have not been hurting as much as those in other capital cities, and in turn, we’ve seen a stabilisation of births in the ACT.”
This stylish family home combines a classic palette and finishes with a flexible floorplan
Just 55 minutes from Sydney, make this your creative getaway located in the majestic Hawkesbury region.