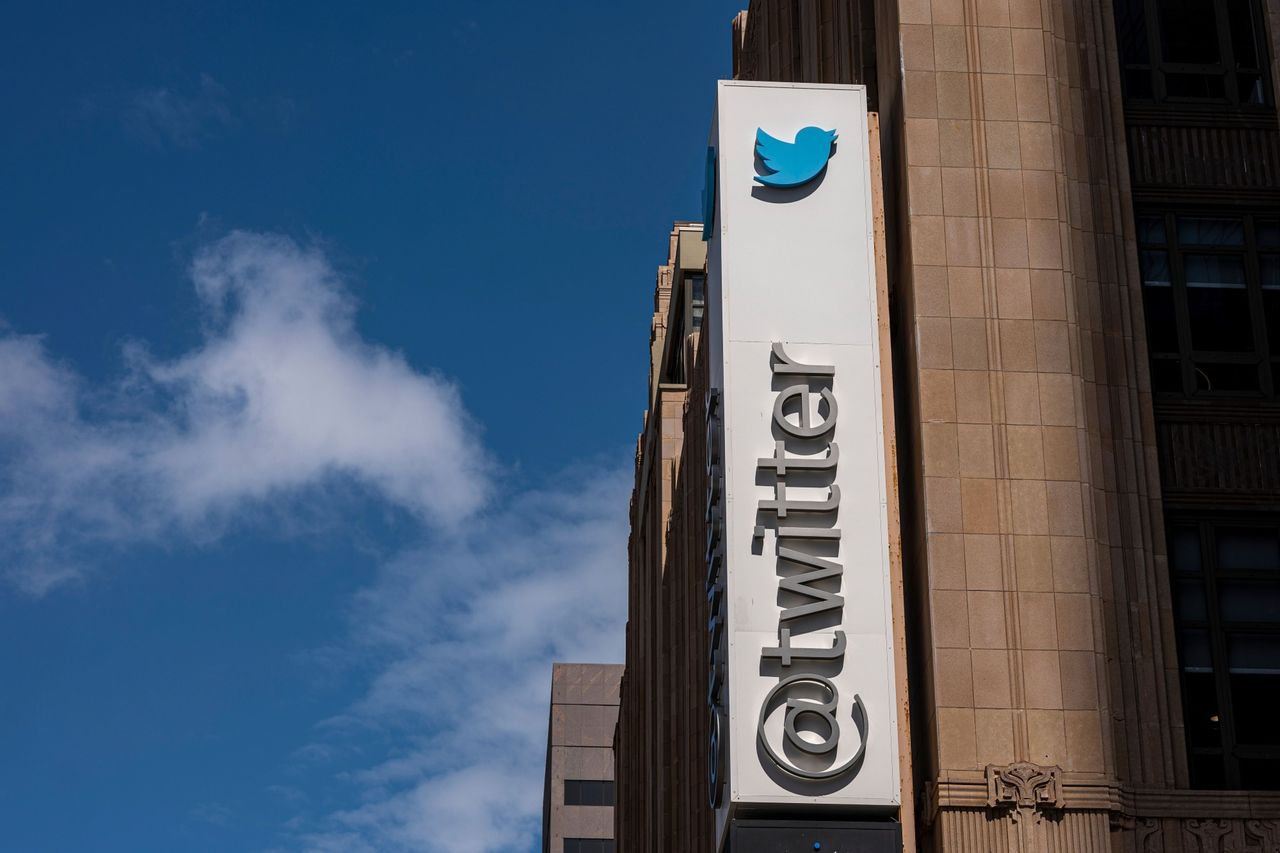
Twitter Stock’s Fall Isn’t Over, Analysts Warn
Kanebridge News
    HOUSE MEDIAN ASKING PRICES AND WEEKLY CHANGE     Sydney $1,603,134 (+0.55%)       elbourne $989,193 (-0.36%)       Brisbane $963,516 (+0.83%)       Adelaide $873,972 (+1.09%)       Perth $833,820 (+0.12%)       Hobart $754,479 (+3.18%)       Darwin $668,319 (-0.54%)       Canberra $993,398 (-1.72%)       National $1,033,710 (+0.29%)                UNIT MEDIAN ASKING PRICES AND WEEKLY CHANGE     Sydney $748,302 (+0.18%)       Melbourne $497,833 (-0.44%)       Brisbane $540,964 (-1.56%)       Adelaide $441,967 (-0.38%)       Perth $442,262 (+1.33%)       Hobart $525,313 (+0.38%)       Darwin $347,105 (-0.72%)       Canberra $496,490 (+0.93%)       National $528,262 (-0.02%)                HOUSES FOR SALE AND WEEKLY CHANGE     Sydney 10,189 (-104)       Melbourne 14,713 (+210)       Brisbane 7,971 (+283)       Adelaide 2,420 (+58)       Perth 6,383 (+298)       Hobart 1,336 (+6)       Darwin 228 (-12)       Canberra 1,029 (+8)       National 44,269 (+747)                UNITS FOR SALE AND WEEKLY CHANGE     Sydney 8,795 (-1)       Melbourne 8,207 (+293)       Brisbane 1,636 (+1)       Adelaide 421 (-4)       Perth 1,664 (+15)       Hobart 204 (-1)       Darwin 404 (-2)       Canberra 988 (+12)       National 22,319 (+313)                HOUSE MEDIAN ASKING RENTS AND WEEKLY CHANGE     Sydney $800 (+$5)       Melbourne $600 ($0)       Brisbane $640 (+$10)       Adelaide $600 ($0)       Perth $660 ($0)       Hobart $550 ($0)       Darwin $700 ($0)       Canberra $690 ($0)       National $663 (+$2)                UNIT MEDIAN ASKING RENTS AND WEEKLY CHANGE     Sydney $750 ($0)       Melbourne $590 (+$10)       Brisbane $630 ($0)       Adelaide $490 (+$10)       Perth $600 ($0)       Hobart $475 (+$23)       Darwin $550 ($0)       Canberra $570 (+$5)       National $593 (+$4)                HOUSES FOR RENT AND WEEKLY CHANGE     Sydney 5,364 (+80)       Melbourne 5,428 (+4)       Brisbane 4,002 (+12)       Adelaide 1,329 (+16)       Perth 2,113 (+91)       Hobart 398 (0)       Darwin 99 (-5)       Canberra 574 (+39)       National 19,307 (+237)                UNITS FOR RENT AND WEEKLY CHANGE     Sydney 7,687 (+257)       Melbourne 4,793 (+88)       Brisbane 2,098 (+33)       Adelaide 354 (-11)       Perth 650 (+5)       Hobart 135 (-1)       Darwin 176 (-9)       Canberra 569 (+14)       National 16,462 (+376)                HOUSE ANNUAL GROSS YIELDS AND TREND       Sydney 2.59% (↑)      Melbourne 3.15% (↑)      Brisbane 3.45% (↑)        Adelaide 3.57% (↓)       Perth 4.12% (↓)       Hobart 3.79% (↓)     Darwin 5.45% (↑)      Canberra 3.61% (↑)      National 3.33% (↑)             UNIT ANNUAL GROSS YIELDS AND TREND         Sydney 5.21% (↓)     Melbourne 6.16% (↑)      Brisbane 6.06% (↑)      Adelaide 5.77% (↑)        Perth 7.05% (↓)     Hobart 4.70% (↑)      Darwin 8.24% (↑)        Canberra 5.97% (↓)     National 5.84% (↑)             HOUSE RENTAL VACANCY RATES AND TREND       Sydney 0.8% (↑)      Melbourne 0.7% (↑)      Brisbane 0.7% (↑)      Adelaide 0.4% (↑)      Perth 0.4% (↑)      Hobart 0.9% (↑)      Darwin 0.8% (↑)      Canberra 1.0% (↑)      National 0.7% (↑)             UNIT RENTAL VACANCY RATES AND TREND       Sydney 0.9% (↑)      Melbourne 1.1% (↑)      Brisbane 1.0% (↑)      Adelaide 0.5% (↑)      Perth 0.5% (↑)        Hobart 1.4% (↓)     Darwin 1.7% (↑)      Canberra 1.4% (↑)      National 1.1% (↑)             AVERAGE DAYS TO SELL HOUSES AND TREND       Sydney 29.7 (↑)      Melbourne 30.9 (↑)      Brisbane 31.2 (↑)      Adelaide 25.1 (↑)      Perth 34.4 (↑)      Hobart 35.8 (↑)      Darwin 35.9 (↑)      Canberra 30.4 (↑)      National 31.7 (↑)             AVERAGE DAYS TO SELL UNITS AND TREND       Sydney 30.0 (↑)      Melbourne 30.5 (↑)      Brisbane 28.8 (↑)        Adelaide 25.2 (↓)       Perth 38.3 (↓)       Hobart 27.8 (↓)     Darwin 45.8 (↑)      Canberra 38.1 (↑)      National 33.1 (↑)            
Share Button

Twitter Stock’s Fall Isn’t Over, Analysts Warn

How much more could it tumble?

By Eric J. Savitz
Tue, Jul 12, 2022 2:51pmGrey Clock 3 min

Now that Elon Musk has decided he would rather not own Twitter, Wall Street is scrambling to think through what happens from here, and what the company might be worth on a stand-alone basis.

Twitter shares plunged 11.3% on the news Monday, but still seemed priced to reflect the possibility a deal will still happen at a lower price. If there is no sale, Twitter stock could tumble another 30% from here, analysts say.

In a letter disclosed in an SEC filing late Friday afternoon, attorneys for Musk said that he is terminating his $54.20-a-share deal to buy Twitter (ticker: TWTR), asserting that the company breached the terms of their agreement by not fully disclosing details relating to the use of fake accounts on the site. Twitter denies withholding this information, and said that it will file suit to force Musk to complete the deal.

Twitter closed Monday at $32.65 a share, well below the bid price, but arguably still well above the company’s intrinsic value. Most Street analysts seem to think that Twitter as an independent company with no acquisition potential based on the current outlook would trade in the $25 to $30 a share range.

Keep in mind that 2022 has been a terrible year for social media stocks. While Twitter is off 23% for the year to date, that is a relatively modest decline compared with Pinterest (PINS), off 49%; Meta (META), off 51%; and Snap (SNAP), down 70%.

MKM Partners analyst Rohit Kulkarni notes that Snap, Pinterest and Meta are all trading at all-time low multiples of forward Ebitda, or earnings before interest, taxes, depreciation and amortization. Twitter, he notes, is trading at about 16 times, but troughed at 12 times at the March 2020 low, and previously dropped to 9 times in April 2016. Put a low-teens multiple of Ebitda on the stock, he says, and the shares would be in the $24 to $26 range. Other analysts draw the same conclusion.

There are differences of opinion on the Street about what happens from here, but they mostly fall into two camps.

A few analysts think the deal gets renegotiated at a lower price. Benchmark analyst Mark Zgutowicz asserts that US$37 would be a “good compromise,” and that a deal at that level would be in the best interest of shareholders. “We suspect neither party wants a long, drawn-out legal battle, and Twitter’s board must contemplate the potential harm to its employee and shareholder base of any additional internal data exposed in litigation. We do believe Elon Musk ultimately wants to run Twitter and believe the best course of action for both parties is a compromise.”

Mizuho analyst James Lee likewise asserts that “the most reasonable scenario” would be to negotiate a deal at a lower price, or a settlement that allows Musk to walk away, avoiding protracted litigation.

Others think Twitter is going to have to go it alone: CFRA analyst Angelo Zinino agrees that a settlement or revised offer would be the best-case scenario for both sides, but he also thinks Twitter would have a hard time accepting a price reduction large enough to satisfy Musk.

His view that the most likely scenario is that Twitter stays independent. But Zinino warns that the company faces a difficult advertising market for the second half and into 2023, and he also sees risk that the company could see a huge talent drain as doubts grow about the company’s future.

“With Musk officially walking away from the deal, we think Twitter’s business prospects and stock valuation are in a precarious situation,” Zinino writes. “We see risks from an uncertain advertising market, a damaged employee base, and concerns about the status of fake accounts/strategic direction as a stand-alone company.”

Wedbush analyst Dan Ives says the situation is a “nightmare” for Twitter, that results in an “Everest-like” uphill climb “to navigate the myriad of challenges ahead,” including employee turnover, advertising headwinds, and investor worries around the fake account issues, among other things.

JMP Securities analyst Andrew Boone asserts that his gut reaction is that Musk no longer wants to own Twitter, with macro conditions worsening and growing employee attrition. Boone writes in a research note that he “increasingly” thinks Twitter’s future will be to remain independent.

Other scenarios are possible. Conceivably, with the stock down sharply, an alternative bidder could emerge, though none has surfaced so far, and there are no obvious buyers.

It’s also possible that negotiations fail, resulting in protracted litigation, in which either Musk wins, and walks away from the deal, or Musk loses, and gets stuck paying the original price. In either litigation scenario, you can imagine endless appeals that could drag on for eons.

Reprinted by permission of Barron’s. Copyright 2021 Dow Jones & Company. Inc. All Rights Reserved Worldwide. Original date of publication: July 11, 2022.


MOST POPULAR
11 ACRES ROAD, KELLYVILLE, NSW

This stylish family home combines a classic palette and finishes with a flexible floorplan

35 North Street Windsor

Just 55 minutes from Sydney, make this your creative getaway located in the majestic Hawkesbury region.

Related Stories
Property
How much income is required to service a mortgage? It depends on where you live
By Bronwyn Allen 25/04/2024
Money
Australian Inflation Stays Strong, Highlighting Challenge Facing RBA
By DAVID WINNING 25/04/2024
Money
Personal Wardrobe of the Iconic Late Fashion Designer Vivienne Westwood Goes up for Auction
By CASEY FARMER 25/04/2024
How much income is required to service a mortgage? It depends on where you live

New research suggests spending 40 percent of household income on loan repayments is the new normal

By Bronwyn Allen
Thu, Apr 25, 2024 3 min

Requiring more than 30 percent of household income to service a home loan has long been considered the benchmark for ‘housing stress’. Yet research shows it is becoming the new normal. The 2024 ANZ CoreLogic Housing Affordability Report reveals home loans on only 17 percent of homes are ‘serviceable’ if serviceability is limited to 30 percent of the median national household income.

Based on 40 percent of household income, just 37 percent of properties would be serviceable on a mortgage covering 80 percent of the purchase price. ANZ CoreLogic suggest 40 may be the new 30 when it comes to home loan serviceability. “Looking ahead, there is little prospect for the mortgage serviceability indicator to move back into the 30 percent range any time soon,” says the report.

“This is because the cash rate is not expected to be cut until late 2024, and home values have continued to rise, even amid relatively high interest rate settings.” ANZ CoreLogic estimate that home loan rates would have to fall to about 4.7 percent to bring serviceability under 40 percent.

CoreLogic has broken down the actual household income required to service a home loan on a 6.27 percent interest rate for an 80 percent loan based on current median house and unit values in each capital city. As expected, affordability is worst in the most expensive property market, Sydney.

Sydney

Sydney’s median house price is $1,414,229 and the median unit price is $839,344.

Based on 40 percent serviceability, households need a total income of $211,456 to afford a home loan for a house and $125,499 for a unit. The city’s actual median household income is $120,554.

Melbourne

Melbourne’s median house price is $935,049 and the median apartment price is $612,906.

Based on 40 percent serviceability, households need a total income of $139,809 to afford a home loan for a house and $91,642 for a unit. The city’s actual median household income is $110,324.

Brisbane

Brisbane’s median house price is $909,988 and the median unit price is $587,793.

Based on 40 percent serviceability, households need a total income of $136,062 to afford a home loan for a house and $87,887 for a unit. The city’s actual median household income is $107,243.

Adelaide

Adelaide’s median house price is $785,971 and the median apartment price is $504,799.

Based on 40 percent serviceability, households need a total income of $117,519 to afford a home loan for a house and $75,478 for a unit. The city’s actual median household income is $89,806.

Perth

Perth’s median house price is $735,276 and the median unit price is $495,360.

Based on 40 percent serviceability, households need a total income of $109,939 to afford a home loan for a house and $74,066 for a unit. The city’s actual median household income is $108,057.

Hobart

Hobart’s median house price is $692,951 and the median apartment price is $522,258.

Based on 40 percent serviceability, households need a total income of $103,610 to afford a home loan for a house and $78,088 for a unit. The city’s actual median household income is $89,515.

Darwin

Darwin’s median house price is $573,498 and the median unit price is $367,716.

Based on 40 percent serviceability, households need a total income of $85,750 to afford a home loan for a house and $54,981 for a unit. The city’s actual median household income is $126,193.

Canberra

Canberra’s median house price is $964,136 and the median apartment price is $585,057.

Based on 40 percent serviceability, households need a total income of $144,158 to afford a home loan for a house and $87,478 for a unit. The city’s actual median household income is $137,760.


MOST POPULAR
11 ACRES ROAD, KELLYVILLE, NSW

This stylish family home combines a classic palette and finishes with a flexible floorplan

35 North Street Windsor

Just 55 minutes from Sydney, make this your creative getaway located in the majestic Hawkesbury region.

Related Stories
Money
Slowly but surely, inflation moves in the right direction
By KANEBRIDGE NEWS 10/01/2024
Money
One Country’s Dream of EV-Driven Prosperity Helps Fuel a Coal Binge Instead
By JON EMONT 05/02/2024
Money
Yes, Even Cookie Monster Is Upset About ‘Shrinkflation’
By JOSEPH PISANI 06/03/2024
0
    Your Cart
    Your cart is emptyReturn to Shop