We’re Spending Billions on This Work-From-Home Indulgence
Without the boss nearby, who can resist placing that Amazon order?

 4 min
4 min
Click. Scroll. Add to cart. Now toggle back to that Zoom meeting.
On our remote days, it turns out, we shop while we work. Researchers say it’s driving billions in online sales. There we all are, browsing everything from toothpaste to concert tickets while nodding along on a video call , keying in credit-card info in between dashing off emails to the boss.
Shopping away our entire workday is obviously a bad move. But indulging in a little isn’t going to tank productivity. We pause and procrastinate at the office, too, in ways that are acceptable there. At home, we gather around clothing reviews like we’re hanging out at the office water cooler, and tick errands off our list via Target.com.
With no one looking over our shoulders, we can puncture the monotony of another vanilla workday with the dopamine high of finding the perfect pair of shoes. Even if we might sometimes regret it.
“I wouldn’t have bought this stupid thing if it weren’t for All Hands,” Megan Morreale , a content marketer in New Jersey, thought to herself after purchasing an influencer’s branded candle during a companywide meeting. Bored or between calls, the 32-year-old scrolls Instagram, TikTok and YouTube. Days later, subpar art supplies or a viral dress that really doesn’t suit her land on her doorstep. Oh well.
“It’s a little bit of fun during the day,” she says, without the fear you’ll look like a slacker . At the office, she would never. “All the guilt is completely gone when you work from home.”
A $375 billion boost
Our collective retail therapy adds up. New research from Stanford University, Northwestern University and the Mastercard Economics Institute, the payments company’s research arm, finds the pandemic prompted a rise in online shopping that’s persisted. Last year, for example, we spent $375 billion more than we would have otherwise, the report estimates.
The brunt of that bump is being driven by people working hybrid or fully remote schedules, says Nick Bloom , a Stanford economist and co-author. County-level data shows that in areas where work-from-home jobs are prevalent, online shopping is up, while it’s back to pre pandemic levels in places where more folks work in-person.
Along with walking the dog and getting a jump on dinner, workday shopping is a way to make efficient use of our time, Bloom says, and take advantage of the fact that we have more control over it at home.
“People just can’t work continuously without taking a break,” he says.
Get away without leaving your desk
At home, there’s freedom and time, but also often inertia.
“There’s no coffee break, there’s no somebody’s birthday,” says Ace Bhattacharjya , chief executive of a company that helps folks access their medical records.
Instead, there’s perusing a limited-edition sneaker drop, or collectible figurines on eBay, Bhattacharjya says, recalling some of his recent scrolling. Everything in stores looks the same these days, he finds, but online he can jump down a rabbit hole into random micro communities and inspiration. Turning his attention from the work on his computer monitor to e-commerce on his iPad Pro gives him a jolt of creativity and energy.
Besides, the lines between work and everything else have grown hazy. Bhattacharjya’s hours bleed into the weekends. That can feel like permission to wedge some personal stuff into the workweek.
Ooh, a sale!
Weekly online spending peaks from 10 a.m. to 1 p.m. on Fridays , as the workweek slows to its languorous end, data from Adobe shows. More than a quarter of women surveyed last year by shopping portal Rakuten said they typically shop online during work hours. For Gen Z, the share was 41%.
Jenny Hirschey , who runs an Instagram jewellery shop from St. Paul, Minn., was surprised to find about 80% of her sales are made during the workday.
“I get comments all the time like, ‘I’m running to a meeting but this heart charm is mine! Sold! I’ll pay you in 30 minutes,’” she says.
Big retailers have noticed the trend, too, says Liza Amlani , a retail consultant and adviser based in Toronto who’s worked with companies like Under Armour and Lands’ End.
Some of her clients are timing things like product drops and marketing emails around noon or 3 p.m.
“We know that you’re on your computer,” captive and craving a pick-me-up, she says.
Retailers have also ramped up their investments in online tech, and are flooding their websites with more product, she adds. Algorithm-powered recommendations are getting so powerful it can feel like they know your subconscious desires before you do. Oh, and did you forget about that item you halfheartedly popped in your cart? Here’s 20% off.
“You’re getting so much more of that reminder and that call to buy,” says Nancy Wong , a consumer psychologist at University of Wisconsin-Madison.
The seduction of online shopping
Bricks-and-mortar browsing comes with unknowns and annoyances: traffic en route, long lines at the store, finding out what you want isn’t in stock.
In contrast, Wong says, clicking the buy button online brings a satisfying certainty, and a double hit of pleasure. There’s the immediate high of plucking the item from the virtual shelf—then, the anticipation of its arrival. Sure, that gadget might be a flop once it gets here. But it’s on its way.
“It’s so seductive,” says Michelle Drapkin , a therapist in New Jersey who works a hybrid schedule.
When she worked for a big healthcare company years back, she’d never dream of pulling up Amazon on her office computer.
On her work-from-home days now, she’ll sometimes flop on her bed with a laptop and check purchases off her to-do list. It’s relaxing, she says. “I can do something different than work that’s still productive.”
Some purchases, like groceries, keep her household running. Others, like a new dress for a Kentucky Derby party, feel like a treat.
By the time the purchase arrives, though, she’s usually forgotten what’s inside the box.
 Copyright 2020, Dow Jones & Company, Inc. All Rights Reserved Worldwide. LEARN MORE





From making unpopular decisions to learning when to listen, leaders from five businesses reveal what nobody prepared them for — and how running a company has challenged their expectations.

Technology and semiconductor shares fell sharply as investors questioned the debt financing the AI infrastructure boom and confronted higher rates and Chinese competition.

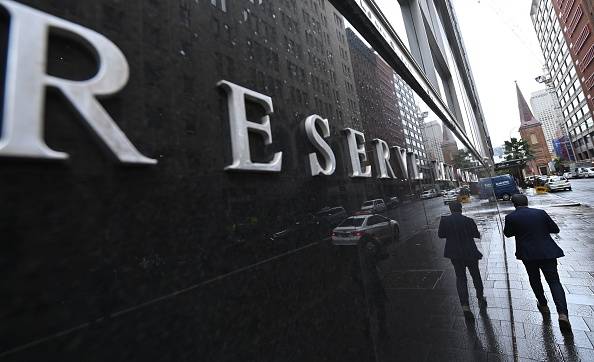
Technology and semiconductor shares fell sharply as investors questioned the debt financing the AI infrastructure boom and confronted higher rates and Chinese competition.
4 minA sharp technology sell-off has exposed a new anxiety on global markets: whether the enormous borrowing behind the artificial-intelligence infrastructure boom can generate sufficient returns as interest rates rise and Chinese competition intensifies.
The artificial-intelligence investment boom has powered technology shares, semiconductor manufacturers and data-centre operators to extraordinary heights. Last week, investors were given a reminder that much of this expansion is being built with borrowed money.
The technology-heavy Nasdaq Composite fell 4.5 per cent over the week ended October 16, its weakest performance since late June. Semiconductor shares suffered an even deeper correction, with the Philadelphia Semiconductor Index losing about 11.4 per cent.
The selling spread quickly through global markets. Micron Technology fell 14.6 per cent over the week, while South Korea’s Samsung Electronics and SK Hynix dropped approximately 18 per cent and 24 per cent respectively.
This was more than a routine bout of profit-taking. Investors were reassessing three interconnected risks: higher interest rates, the rapidly expanding debt burden attached to AI infrastructure and the prospect of stronger competition from Chinese memory-chip manufacturers.
The debt behind the AI build-out
Artificial intelligence requires a physical infrastructure network of enormous scale. Data centres must be built, advanced processors purchased, power supplies secured and cooling systems installed before customers begin generating meaningful revenue from them.
Technology companies are increasingly supplementing their own cash with corporate bonds, syndicated loans, equipment leases, private credit and project-level financing.
JPMorgan describes the emerging funding model as a combination of conventional corporate borrowing and project finance tied to individual data-centre assets. In Australia, the Reserve Bank estimates that syndicated loans accounted for approximately three-quarters of data-centre financing during 2025 and 2026 to date.
The numbers are becoming large enough to affect broader credit markets. The Federal Reserve Bank of Dallas has cited Wall Street estimates suggesting AI-related investment-grade bond issuance could approach US$300 billion in 2026 alone.
That borrowing is not automatically problematic. Debt can be an efficient way to finance long-lived infrastructure when future revenue is sufficiently predictable. The concern is that AI technology, customer demand and computing economics are changing much faster than the repayment schedules attached to the assets.
A data centre financed today may carry debt for years. Investors must therefore make assumptions about future utilisation rates, electricity prices, chip performance, customer concentration and the amount businesses will ultimately pay for AI computing.
When interest rates rise, those assumptions become less forgiving.
Inflation changes the calculation
September’s US inflation data intensified the pressure. Consumer prices increased 3.7 per cent over the year, ahead of market expectations and up from 3.4 per cent in August.
The hotter reading reduced confidence that interest rates would fall quickly and pushed bond yields higher. That matters particularly for companies whose valuations depend on profits expected well into the future, as well as highly leveraged infrastructure operators that may need to refinance.
CoreWeave has emerged as a closely watched test case. The specialist cloud-computing company has accumulated substantial debt and lease obligations to build AI capacity, while relying on a concentrated group of large technology customers.
Its shares fell sharply during the sell-off, while the cost of insuring its debt against default climbed. CoreWeave has argued that its contracted backlog more than covers its obligations and that financial markets do not always understand its business model. Nevertheless, its securities have become a proxy for investor confidence in debt-funded AI infrastructure.
Oracle, another major investor in AI computing capacity, fell 8.8 per cent in Friday trading, while CoreWeave dropped 15.5 per cent.
The question is shifting from how much AI infrastructure can be built to how profitably it can be operated.
China adds another source of pressure
Interest rates were not the only catalyst. Reports of advances by Chinese memory-chip producer ChangXin Memory Technologies raised concerns that lower-cost Chinese products could increase competition across the global semiconductor industry.
Memory chips are essential to AI systems, but the industry is historically cyclical. Periods of tight supply and high pricing can encourage rapid investment, eventually producing oversupply and falling margins.
The prospect of a well-funded Chinese competitor expanding its technological capabilities unsettled investors in Samsung, SK Hynix and Micron. It also demonstrated that AI-related demand does not insulate chipmakers from conventional competitive pressures.
That combination—slower rate cuts, more expensive financing and potentially cheaper supply—challenged the assumption that every company exposed to AI would enjoy continually expanding margins.
A reset rather than the end of the boom
The sell-off does not establish that the AI boom is ending. Demand for computing power remains strong, the largest technology companies continue to generate formidable cash flows and many infrastructure projects are backed by long-term customer contracts.
What has changed is the market’s willingness to overlook the price and financing structure of that growth.
The most resilient companies are likely to be those able to fund investment from operating cash flow, secure long-duration customers and demonstrate that new capacity will earn returns comfortably above its financing costs.
More speculative operators may face greater scrutiny, particularly where debt is expensive, customers are concentrated or expected revenue depends on demand that has not yet materialised.
For Australian investors, the lesson extends beyond US technology shares. Local data-centre operators, infrastructure funds, electricity suppliers and property groups are increasingly exposed to the same investment cycle.
Artificial intelligence may remain one of the defining growth themes of the decade. But last week’s correction showed that enthusiasm for the technology does not eliminate financial discipline.
The next stage of the AI boom will be judged not only by computing power, model performance or demand for chips, but by something more traditional: whether the assets being financed can generate enough cash to repay the money borrowed to build them.
Fact box
Nasdaq Composite: Down 4.5 per cent for the week ended October 16, 2026
Philadelphia Semiconductor Index: Down approximately 11.4 per cent
Micron Technology: Down approximately 14.6 per cent
Samsung Electronics: Down approximately 18 per cent
SK Hynix: Down approximately 24 per cent
US September inflation: 3.7 per cent annually
Estimated 2026 AI-related investment-grade issuance: Approximately US$300 billion

From Tokyo backstreets to quiet coastal towns and off-grid cabins, top executives reveal where they holiday and why stepping away makes the grind worthwhile.

Following the successful launch of its Palais Collection, MAISON de SABRÉ has unveiled a new modular handbag system offering more than 720 styling combinations.