


Workers’ Pay Globally Hasn’t Kept Up With Inflation
Decline in purchasing power could reverse this year if prices rise more slowly

 4 min
4 min
Wage growth across advanced economies is plateauing or declining from high levels. For central banks, it is good news: There are no signs of a spiral in which wages push up prices, which push up wages again. That makes it more likely inflation could decline without a significant increase in unemployment.
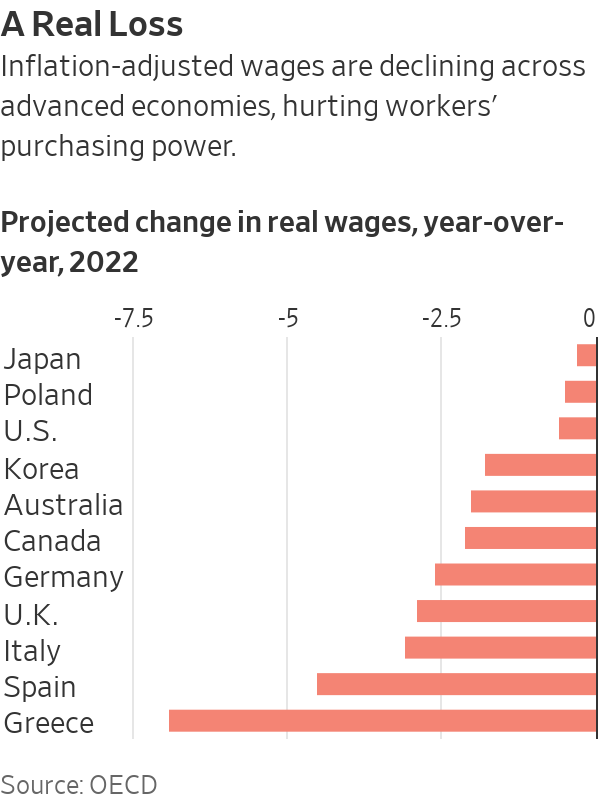
For workers, though, it is less positive. Wages rose faster last year than in the previous two years, but not as much as prices across major advanced economies, according to projections by the International Labour Organization. Workers’ purchasing power—their average inflation-adjusted wage—was lower last year than in 2019, before the pandemic, according to the report. So despite strong demand for workers and ultralow unemployment, labor’s share of economic output shrank in many advanced economies.
In the U.S., nominal wage growth—meaning unadjusted for inflation—has slowed sharply since the middle of last year, according to a variety of measures. Average hourly earnings for private-sector nonfarm workers rose 4.4% in the 12 months through January, down from 5.6% last March and less than the 6.4% rise in consumer prices in the year through January.
In Europe, average wage growth across six countries declined to 4.9% in December from 5.2% in November, according to a report by Ireland’s central bank and the recruitment company Indeed, which tracks advertised wages across millions of online job ads. Inflation in the eurozone ended the year at 9.2%.
In Canada, central bank chief Tiff Macklem highlighted easing wage growth to explain the bank’s recent decision to pause interest-rate increases after raising its key rate to 4.5%, the highest level in 15 years.
“Wage growth is currently running between 4% and 5% and appears to have plateaued within that range… The risk of a wage-price spiral has diminished,” Mr. Macklem said.
Economists have noted that pay growth tends to lag, not lead, inflation as workers and employers adjust pay expectations to the prices they have experienced. Thus, the recent decline in pay growth might reflect, with a lag, the fact inflation peaked around summer and fall of last year in major economies like the U.S. and eurozone and has since declined, as energy prices fell sharply and global supply-chain pressures eased.
Why, though, did wages never catch up with inflation in the first place? One reason is that wages tend to be sticky, changing relatively slowly and sluggishly—over months and years—while prices can change more rapidly. Firms might be wary of raising wages aggressively since cutting them later would be bad for morale.
Now, slowing economic growth and the threat of layoffs might be tempering workers’ demands, said Andrea Garnero, an economist with the Organization for Economic Cooperation and Development. Labor unions in Europe have grown more concerned about job security than wages, he said.
Workers’ pay demands have been reasonable in part because their incomes were supported by government aid during the pandemic and energy crisis, said Gabriel Makhlouf, governor of Ireland’s central bank. “People understand that they can make things worse if they require the wrong [pay] deal,” he said in an interview.
Crucially, the number of workers, which shrank in the first months of the pandemic, is rebounding in many advanced economies, helping to ease shortages.
Some workers who left the labor force during the pandemic are being tempted back as pandemic savings dwindle and are eroded by inflation. Almost 83% of Americans ages 25-54 are working or actively looking for work, roughly back to the pre pandemic rate, according to the U.S. Labor Department. About 86.5% of Europeans ages 25-54 have jobs or are actively searching, 1 percentage point above prepandemic levels. The U.K. stands out for a decline in its labor-force participation coupled with unusually strong wage growth, suggesting that a shortage of workers could be driving pay higher.
Immigration has also rebounded strongly in recent months, hitting record levels in Canada, Spain and Germany as some governments try to make up for shortfalls during the pandemic.
In the U.S., net international migration added more than a million people to the population in the year through mid-2022, the Census Bureau said. Migrant workers could have helped fuel January’s robust 517,000 increase in nonfarm payrolls while keeping wage inflation moderate, said Torsten Slok, chief economist at Apollo Global Management. The same forces could be at play in Europe, he said.
History suggests that workers often fail to claw back losses from high inflation. In the U.S., periods of high inflation were, in general, periods of lower real-wage growth, according to research by the Federal Reserve Bank of St. Louis. High inflation in Australia in the 1970s and 1980s led to real income losses for workers, according to the country’s central bank.
But there are reasons to think real wages might recover soon. Wage growth remains around its fastest in at least a decade across a range of advanced economies. It could stay elevated as wage bargaining proceeds.
Absent a deep recession, unemployment could stay low enough to preserve some bargaining power for workers. The labor supply is being constrained by aging populations across advanced economies and increased worker absences due to illness, often Covid-19.
And markets are betting inflation will fall rapidly this year across advanced economies. If so, it could well fall below wage growth, so real wages would rise—along with workers’ share of the economic pie.
 Copyright 2020, Dow Jones & Company, Inc. All Rights Reserved Worldwide. LEARN MORE


Ophora Tallawong has launched its final release of quality apartments priced under $700,000.

From bushland greens to valley reds, the country’s most awarded designers are proving that the best colour palette was never on a swatch card; it was outside the window all along.


The federal budget has rattled property investors. But the biggest mistake isn’t the tax changes, it’s the conclusion many are drawing from them.
2 min
The recent budget has forced a reckoning for property investors.
Negative gearing now restricted to new residential builds, the CGT discount gone and on paper, the numbers look different.
And many investors are responding by pivoting toward yield, prioritising cash flow over capital growth in a way that property strategists say misses the point entirely.
“The debate has shifted to yield versus growth as if they are opposing forces,” says Abdullah Nouh, founder of Melbourne-based buyers’ agency Mecca Property Group. “But that framing is itself the mistake.”
Nouh, who works with high-net-worth families and investors on long-term acquisition strategy, argues that capital growth remains the primary driver of genuine wealth creation and that the post-budget environment has made quality assets more important, not less.
The numbers make his case plainly. An additional $500 per week in rental income is welcome. A prestige asset appreciating by $1 million over a market cycle is transformative.
These are not equivalent outcomes, and portfolios built around yield at the expense of location and land value tend to generate income while wealth stands largely still.
The more nuanced shift Nouh is seeing among sophisticated investors is a move toward assets where both outcomes can be engineered simultaneously – established homes on substantial land in quality locations, where the existing dwelling can be repositioned, rental returns improved, and the underlying land value compounds independent of what sits on it.
For investors with existing equity, commercial property is also entering the conversation in a more serious way.
Prestige industrial assets, medical centres and long-leased essential retail offer income profiles that residential property in most capital city markets cannot currently match: longer lease terms, tenants covering outgoings, and greater predictability than the residential tenancy cycle.
“The investors who build lasting wealth are rarely the ones who chased yield or growth exclusively,” says Nouh.
“They are the ones who built a strategy they could sustain – one that generated enough income to hold quality assets through multiple cycles while those assets compounded in value.”
The budget has changed the settings. It has not changed the fundamentals.

The pandemic-fuelled love affair with casual footwear is fading, with Bank of America warning the downturn shows no sign of easing.

New research suggests that bonuses make employees feel more like a mere cog in a wheel.


