2023: A Year of Economic Turbulence — and Resilience
 5 min
5 min
OPINION
As 2023 draws to a close, we are presented with an opportune moment to reflect on a year marked by economic resilience and a transformation of our economic environment that has not been seen for decades. We continue to push through the complex circumstances presented by the post-COVID recovery, remaining inflation, and the aggressive array of official interest rate increases during 2023.
Just as we see signs that the fight against global inflation may have finally resolved during an astounding year of economic resilience, there remains the threat of a new set of black swan events lurking in the shadows. We could very well see both global and local economic indicators deteriorating well into 2024. In addition, there remains the major threat of a disruption to global trade due to the Houthi militants’ interference in the Suez Canal.
Undoubtedly, the pace of the economic slowdown hastened in the September quarter with unemployment rising, and GDP only barely increasing by 0.2%, falling short of the anticipated 0.5%. If adjusted for immigration, Australia is officially in a per capita recession.
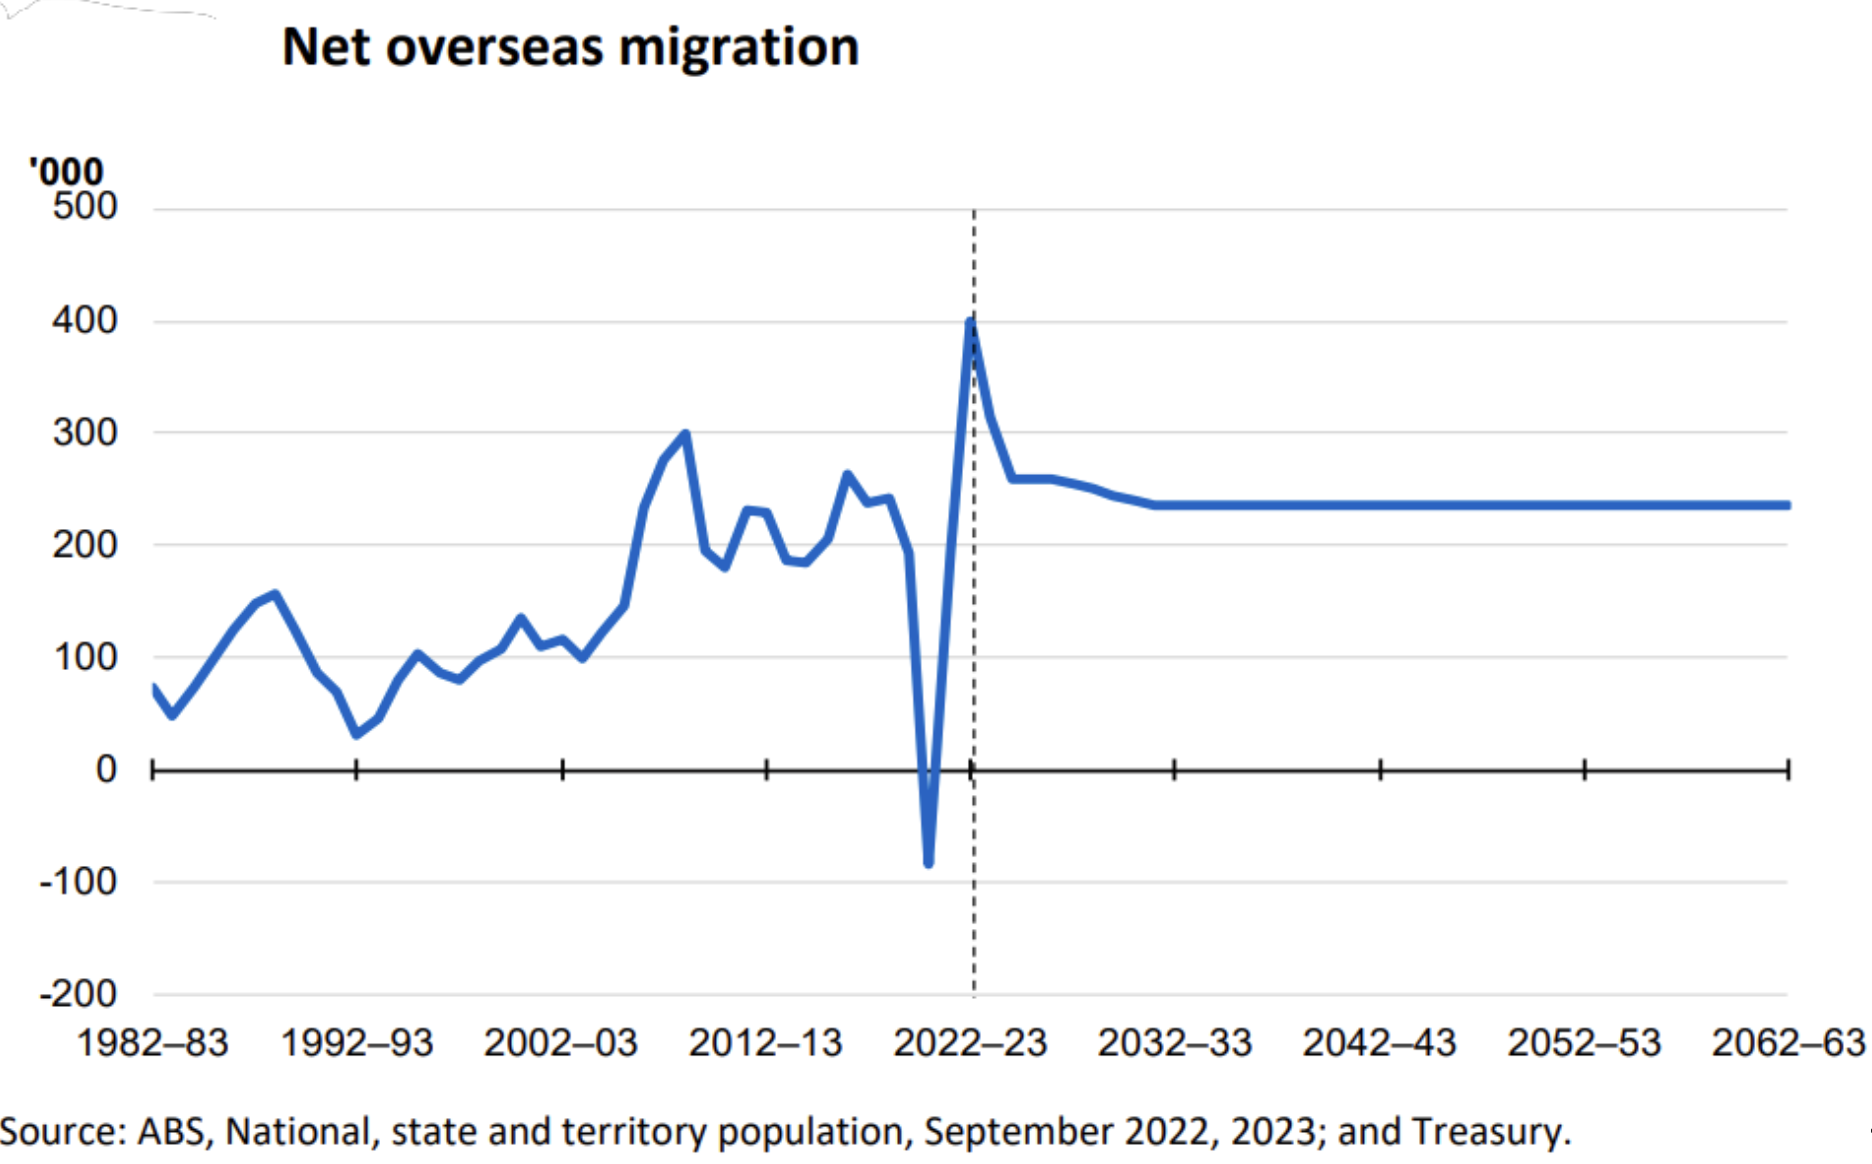
Australia’s record net migration of 2.5% for the 2023 calendar year undoubtedly enabled our economy to remain resilient, while also presenting itself as a potential medium to long-term nuisance. Migration helps ease some of the pressure we are currently experiencing in our tight labour market and leads to higher aggregate demand. However, it also places additional inflationary pressure on housing and rent.
Monetary Policy Outlook
The RBA’s approach to monetary policy has been a topic of much debate, with a very direct transmission channel to mortgage holders in Australia, where there is also higher household leverage. Higher rates end up being passed onto renters and mortgage holders, who comprise roughly 70% of the market. This illustrates the blunt aspect of monetary policy and how it disproportionately impacts certain groups, such as young, lower-income mortgagors trying to support their family. On the other hand, self-funded retirees are a group that is generally well-placed in a rising interest rate environment.
The RBA’s cautious stance, including the decision to keep the cash rate on hold in December, was a response to the evolving economic situation and clear signs of the economy cooling, including slower GDP growth, lower inflation, and higher unemployment.
Many economists now predict that in 2024, during the 4th quarter, interest rates will begin to be reduced. The question is what the neutral cash rate is estimated to be – somewhere between 2.75% and 3.75% – where the rate neither increases nor decreases inflationary pressure.
Labour Market and Unemployment
A significant aspect of 2023 was the labour market beginning to loosen as consumer spending softened. The unemployment rate in Australia rose to 3.9% in November, indicating a clear upward trend. This was coupled with an increased underemployment trend which is expected to continue throughout 2024.
While the RBA’s primary mandate is to manage inflation, it also has a key role in achieving full employment. There is a concept relating to a neutral unemployment rate, where any further increase has an inflationary impact on the economy. This is referred to as the Non-Accelerating Inflation Rate of Unemployment (NAIRU) and is often referred to in the RBA’s statements. They believe that Australia’s natural rate of unemployment should be 4.5%. Moving closer to this rate allows us to see improvements in productivity whilst not incurring significant inflationary pressure or economic weakening. Indeed, such low unemployment during the year has made our economy extraordinarily resilient in the face of adversity.
As the unemployment rate gets closer to the target of 4.5%, it often impels the RBA to cut the official cash rate.
Household and Household Income
The increase in average mortgage rates and the strain on household budgets were notable over the past year. Real household disposable income declined significantly. Interest paid on housing debt and income tax payable increased substantially, further stressing household finances. Despite these adversities, we have witnessed an extraordinary recovery in property prices during the year, which has been rather counterintuitive from a pure economic standpoint.
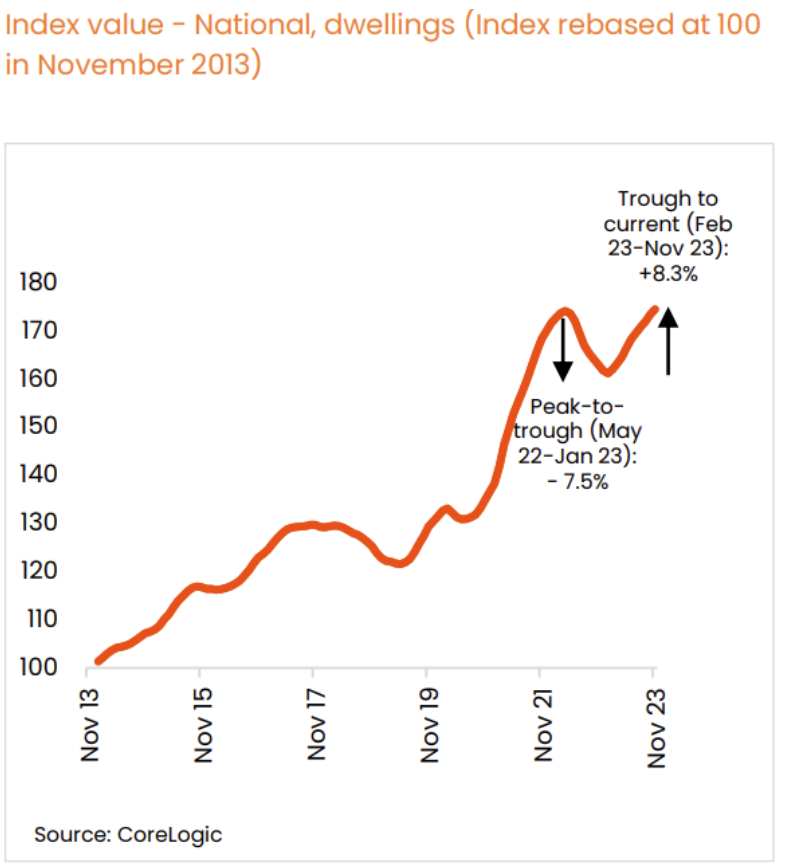
The rationale behind this can be explained by the decade-long chronic shortage of housing supply, combined with high net migration. This reinforces the unrelenting nature of housing demand in Australia. It is also a testament to how families will continue to make sacrifices to enable them to live in their property and avoid renting. As the housing crisis worsens, there is a realisation that residential property is not merely an asset class for investment, but also an essential piece of infrastructure for which all levels of government are responsible to deliver sufficient supply. However, we must remember: there is no immediate or quick fix.
Private Credit’s Role
Private credit, especially secured lending, becomes even more crucial in this uncertain and tumultuous environment. Traditional banks, facing an uncertain economic climate, become more cautious, paving the way for firms like Msquared Capital to provide essential credit to SMEs.
For us at Msquared Capital, our daily interactions with borrowers ensures we are always there to witness and respond to ever-changing conditions. We can see dislocations within the lending market and that is what enables us to find the best risk-rated returns for our investors.
Secured private credit is in high demand as investors navigate uncertain times and move away from riskier assets in which the downside risk is the absolute loss of capital following from heightened market volatility. Investors are seeking a safe haven that provides steady and reliable income, all while being secured by real assets – that is, property – with asset preservation qualities.
Many investors are only now beginning to discover private credit and its benefits. At Msquared Capital we see that there is still a lack of understanding and awareness on the difference between private credit providers and their offerings. Another crucial point to remember is that not all debt, nor fund managers, are the same or of equal quality.
Looking Ahead
2023 was a year of economic turbulence, characterised by slowing growth, a shifting labour market, and evolving monetary policy. For Msquared Capital, this environment necessitates adaptive strategies to navigate the changing landscape. As we look forward to 2024, we remain committed to providing innovative and secure credit solutions, while being mindful of the broader economic context and its implications for our clients and investments.
In our view the RBA will likely continue its inflation-fighting rhetoric, but the need for further rate rises seems to have dissipated given rising unemployment and falling GDP per capita. It is highly unlikely that there will be significant property appreciation in the short-term unless interest rates are reduced more aggressively than anticipated. In addition, some property segments, such as holiday houses, regional areas, and commercial office space, have more inherent downside risk.
Overall, Australia is once again the ‘lucky country’, having been much more resilient than our peers. This is a testament to our resource-rich land, high immigration, farming, stable government, and that we are distanced far enough from other countries so as to not be entangled in their geopolitical mess. This is what allows our lucky country to weather most economic shocks relativity unscathed.
Paul Miron is managing director of Msquared Capital, a private credit provider with investment opportunities backed by quality property located primarily along Australia’s Eastern Seaboard; we ensure that all investment opportunities are based on risk-to-reward as our core offering, coupled with strong performance. Mortgage funds perform well during volatile times, and capital preservation is regular, with a reliable monthly income that gives our investors peace of mind.

Ophora Tallawong has launched its final release of quality apartments priced under $700,000.

From bushland greens to valley reds, the country’s most awarded designers are proving that the best colour palette was never on a swatch card; it was outside the window all along.


The federal budget has rattled property investors. But the biggest mistake isn’t the tax changes, it’s the conclusion many are drawing from them.
2 min
The recent budget has forced a reckoning for property investors.
Negative gearing now restricted to new residential builds, the CGT discount gone and on paper, the numbers look different.
And many investors are responding by pivoting toward yield, prioritising cash flow over capital growth in a way that property strategists say misses the point entirely.
“The debate has shifted to yield versus growth as if they are opposing forces,” says Abdullah Nouh, founder of Melbourne-based buyers’ agency Mecca Property Group. “But that framing is itself the mistake.”
Nouh, who works with high-net-worth families and investors on long-term acquisition strategy, argues that capital growth remains the primary driver of genuine wealth creation and that the post-budget environment has made quality assets more important, not less.
The numbers make his case plainly. An additional $500 per week in rental income is welcome. A prestige asset appreciating by $1 million over a market cycle is transformative.
These are not equivalent outcomes, and portfolios built around yield at the expense of location and land value tend to generate income while wealth stands largely still.
The more nuanced shift Nouh is seeing among sophisticated investors is a move toward assets where both outcomes can be engineered simultaneously – established homes on substantial land in quality locations, where the existing dwelling can be repositioned, rental returns improved, and the underlying land value compounds independent of what sits on it.
For investors with existing equity, commercial property is also entering the conversation in a more serious way.
Prestige industrial assets, medical centres and long-leased essential retail offer income profiles that residential property in most capital city markets cannot currently match: longer lease terms, tenants covering outgoings, and greater predictability than the residential tenancy cycle.
“The investors who build lasting wealth are rarely the ones who chased yield or growth exclusively,” says Nouh.
“They are the ones who built a strategy they could sustain – one that generated enough income to hold quality assets through multiple cycles while those assets compounded in value.”
The budget has changed the settings. It has not changed the fundamentals.

As the season turns, Handpicked Wines’ latest Pinot Noir and Chardonnay releases reveal how subtle shifts in place shape what ends up in the glass.

On October 2, acclaimed chef Dan Arnold will host an exclusive evening, unveiling a Michelin-inspired menu in a rare masterclass of food, storytelling and flavour.